🌍 Public
Untitled
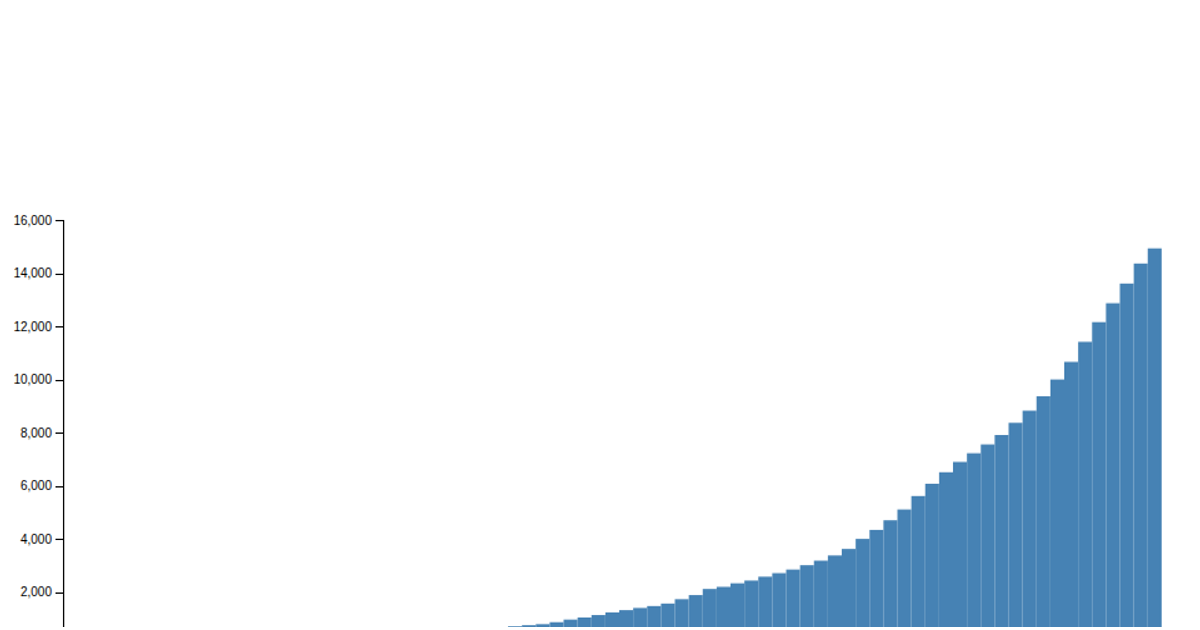
This visualization shows the cumulative growth of a dataset from 1949 to 2019, tracking a running total that increases from 5 to nearly 15,000 over seven decades. The data is loaded from a CSV file using D3’s `csv()` function, though the rendering logic is incomplete in the provided `index.js`. The example demonstrates how to import and parse tabular data with D3 v3, including accessing SVG dimensions via `.attr()` and preparing the data for subsequent plotting. The chart’s design and marks are not yet implemented in the visible code.
AI-generated descriptionMIT Licensed







Comments
Sign in to join the discussion.