🌍 Public
conceptual map
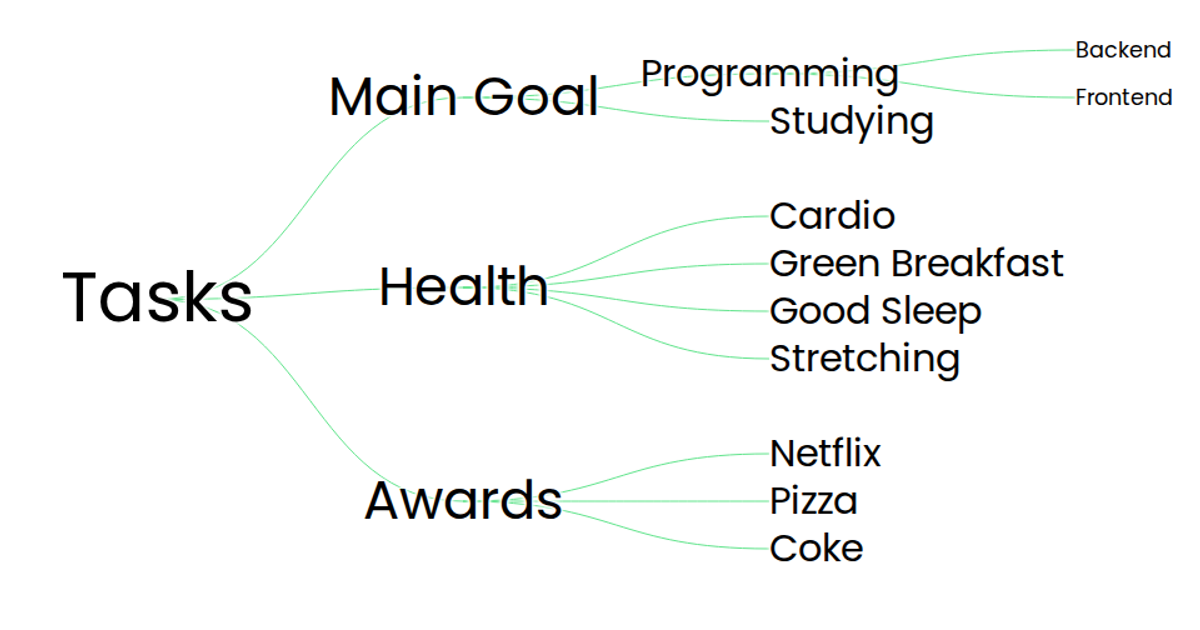
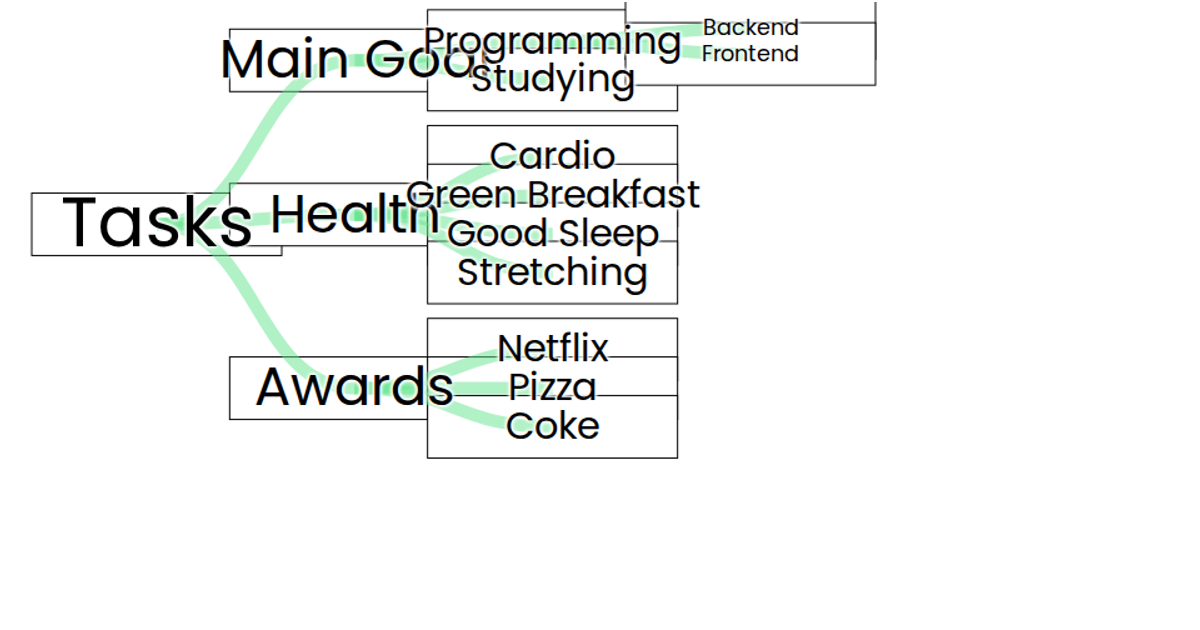
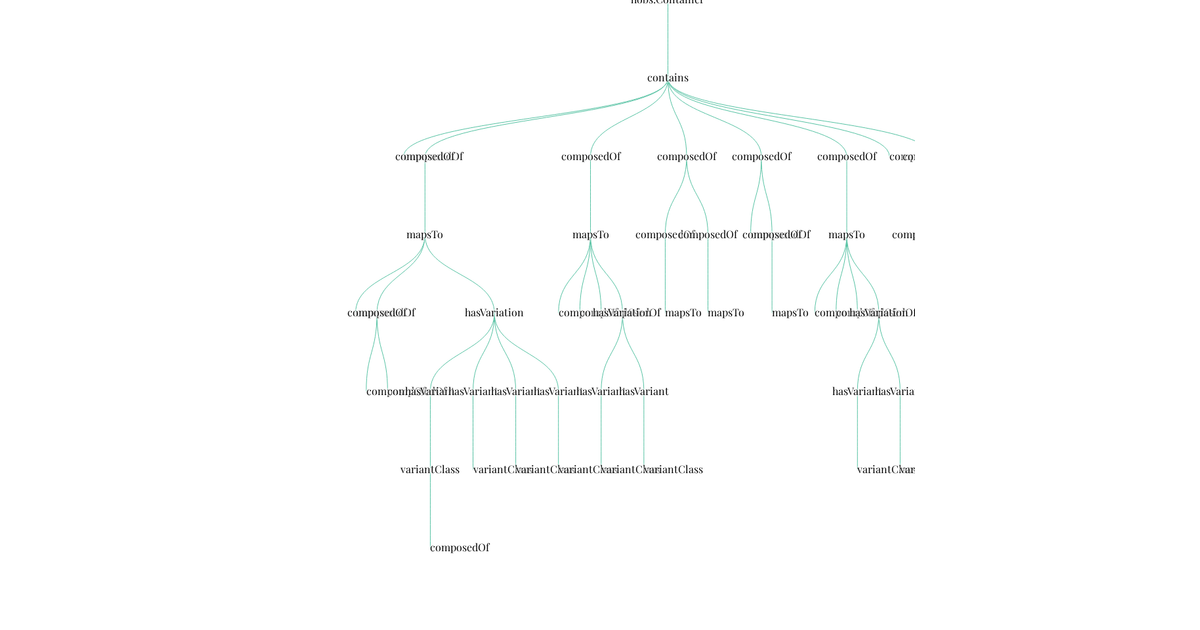
This conceptual map visualizes a hierarchical dataset representing a computer system, with nested nodes for components and subcategories. It uses an icicle tree layout, positioning nodes horizontally from left to right based on their depth in the hierarchy, with text labels sized inversely to depth. The visualization is built with D3.js (v5), using the `tree`, `hierarchy`, `linkHorizontal`, and `zoom` APIs from the `d3` module, and renders the connected nodes as scalable vector graphics (SVG) paths and text elements. The hierarchy is loaded from a JSON file, and user interactions include zooming and panning via a zoom event handler.
AI-generated descriptionMIT Licensed





Comments
Sign in to join the discussion.