🌍 Public
Let's make a map with D3.js!
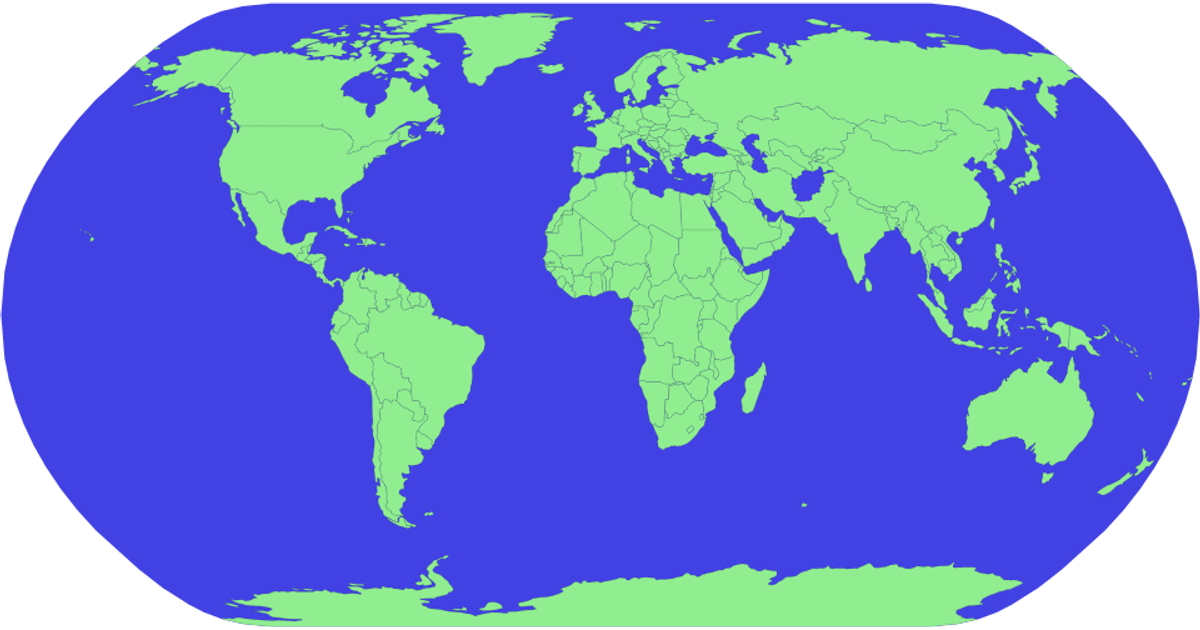
This example demonstrates a world map rendered with D3.js using the geoPolyhedralWaterman projection from d3-geo-projection. It shows country boundaries from a TopoJSON world atlas dataset, overlaid with red rectangles positioned at two specific latitude/longitude coordinates, though the rectangles do not use the map projection and remain in screen space. The visualization uses d3.geoPath to generate SVG paths for countries and a sphere outline, with d3.geoGraticule available for reference lines. The code imports feature from topojson to convert TopoJSON data into GeoJSON features for rendering.
AI-generated descriptionMIT Licensed




Comments
Sign in to join the discussion.