🌍 Public
Scatter Plots of Spotify Track Dataset
JJuliachien
Last edited Nov 13, 2022
Created on Nov 9, 2022
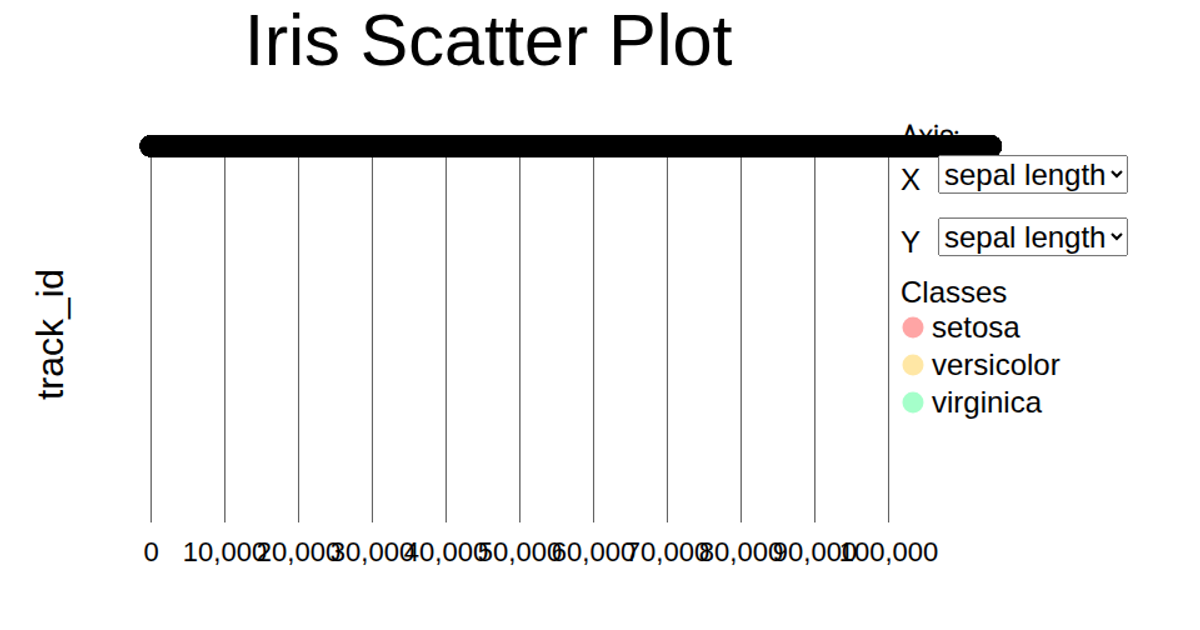
This interactive scatter plot visualizes the Iris flower dataset, mapping sepal and petal measurements along selectable x- and y-axes via two dropdown menus. Users can hover over points to see coordinate tooltips, with points colored by species using a manually defined scale. The visualization uses D3 v5 for scales, axes, and SVG circles, with React dropdowns for attribute selection, and animates point radius on mouseover.
AI-generated descriptionMIT Licensed






Comments
Sign in to join the discussion.