🌍 Public
Fork of Bradley test Fork of D3 Scatter Plot
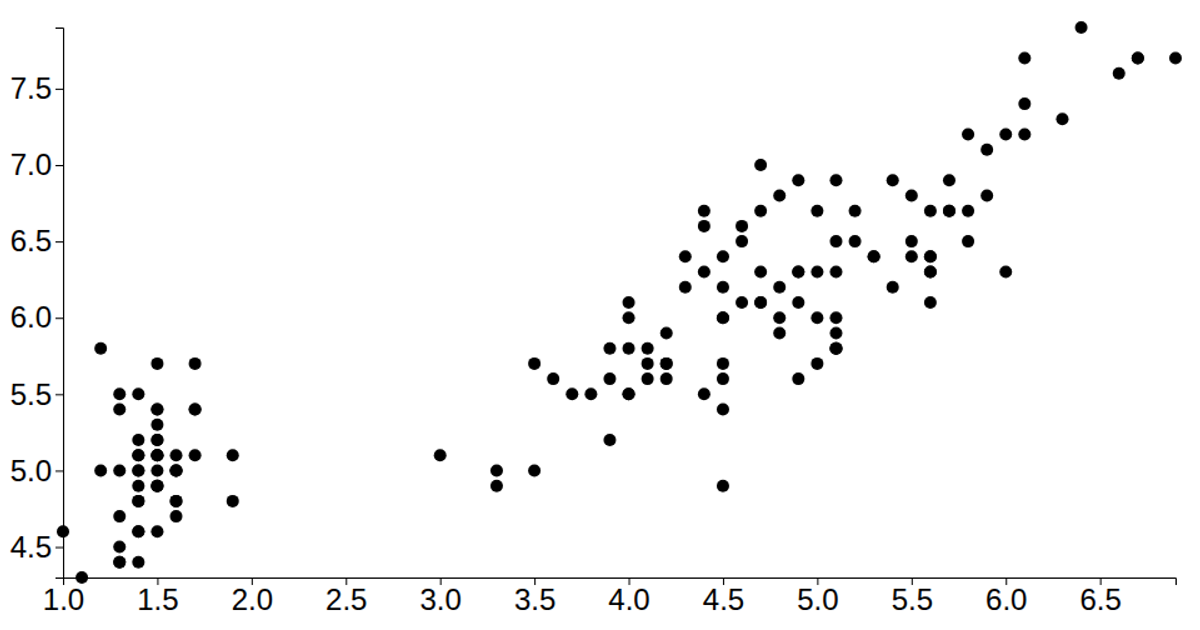
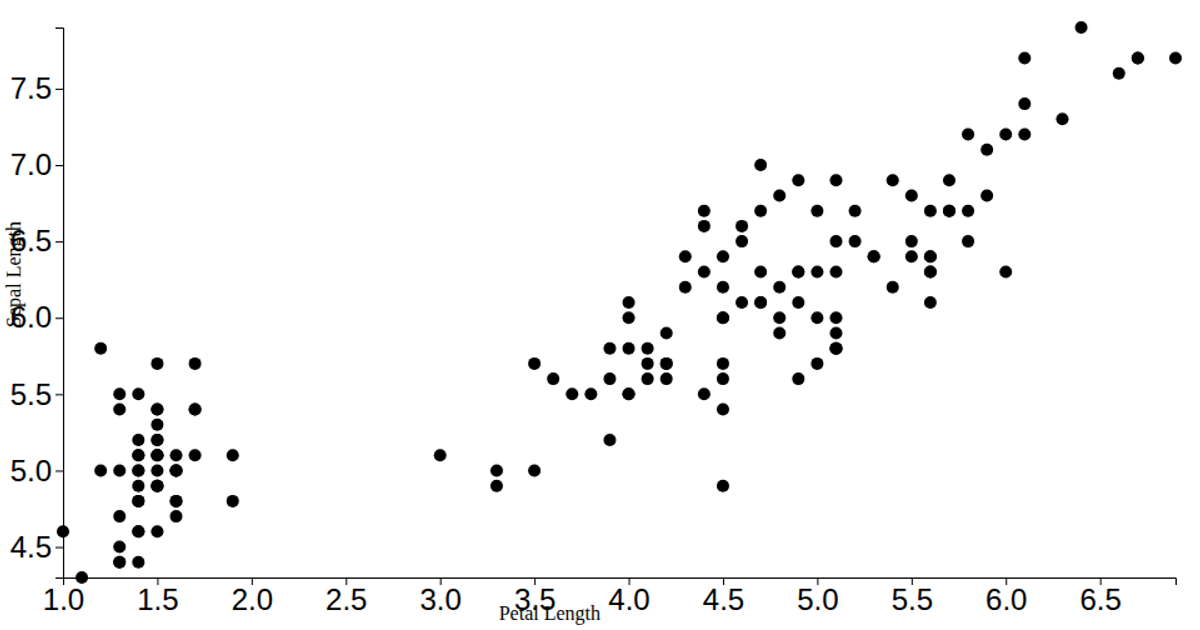
This scatter plot visualizes the Iris dataset, plotting petal length against sepal length for individual flowers. Built with D3 v6, the visualization uses `d3.csv` to load data, `d3.scaleLinear` for axis scaling, and `d3.axisLeft` and `d3.axisBottom` to render axes. The SVG canvas fills the browser window, with each data point drawn as a circle using D3's `selectAll` and `join` operations.
AI-generated descriptionA vanilla HTML implementation of a D3 scatter plot. Shows the Iris Dataset.
MIT Licensed





Comments
Sign in to join the discussion.