🌍 Public
EDAV Project
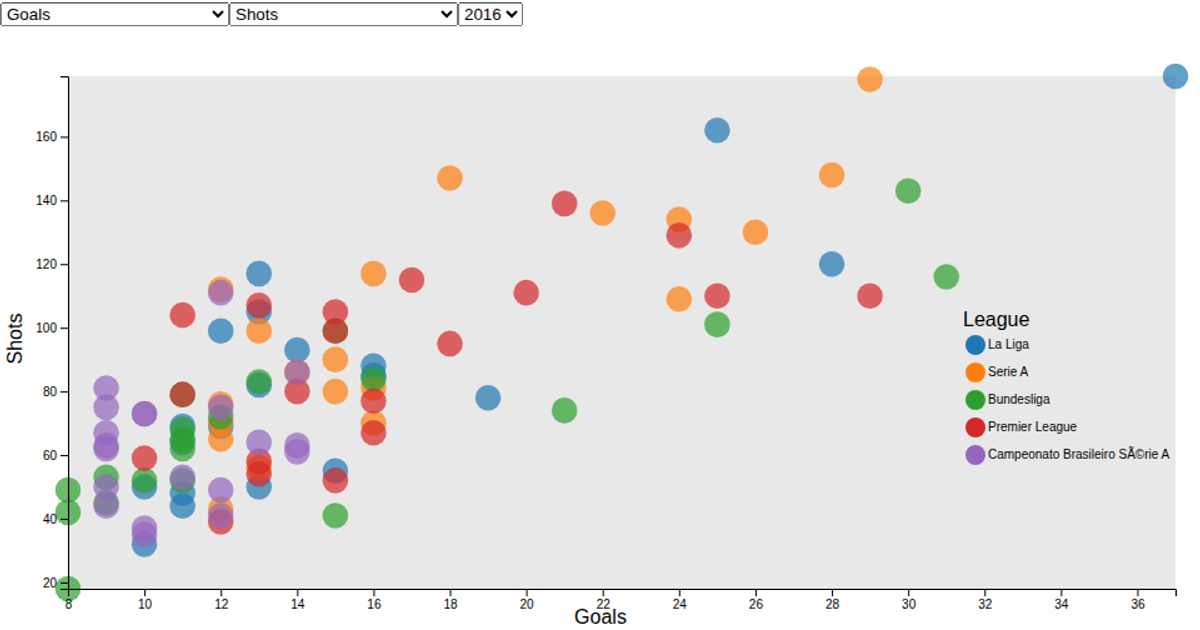
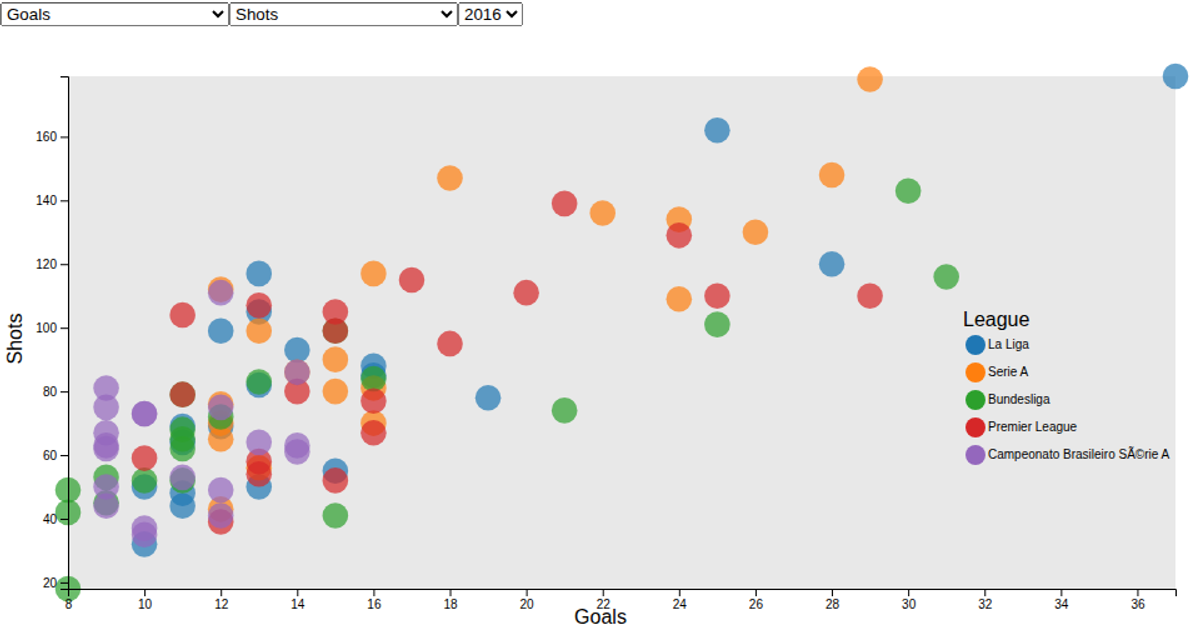
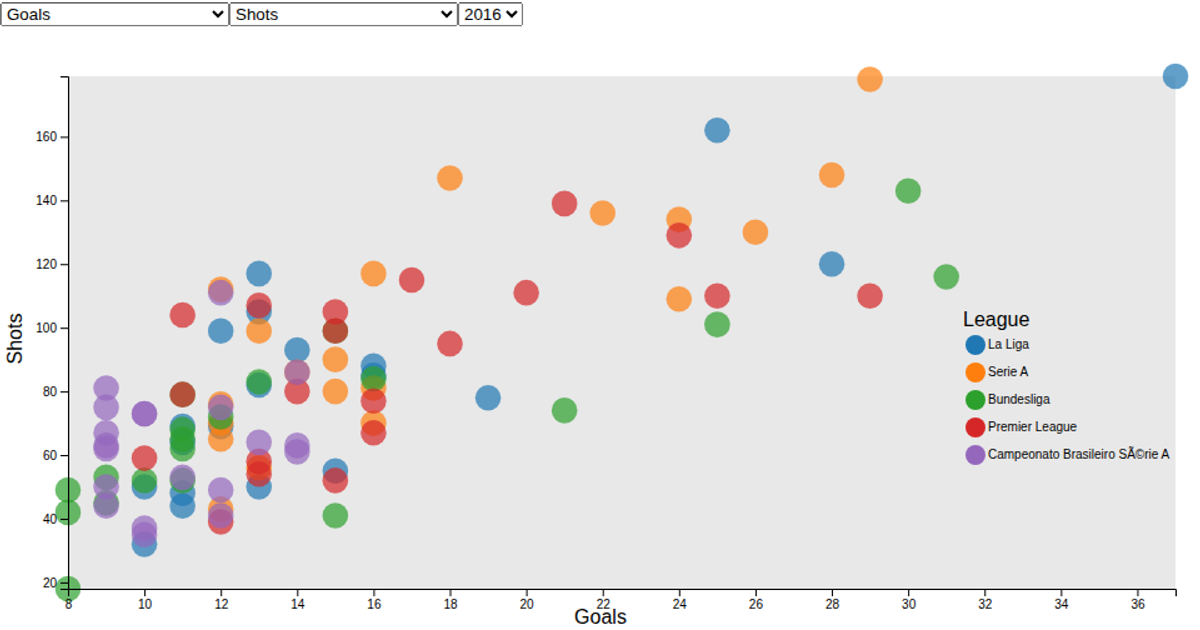
This interactive scatter plot from a Fantasy Premier League dataset shows player cost against total points per season, with color and size highlighting for defenders, midfielders, or forwards. It uses D3.js (v7) with SVG and animation to render the chart. Users can filter by position via radio buttons, which recalculates a linear best-fit line for the selected group, and hover over points to reveal player details. The data is loaded via `d3.csv` from a remote GitHub source.
AI-generated descriptionA bare minimum HTML page demonstrating use of CSS and JavaScript.
See also React Starter.
MIT Licensed




Comments
Sign in to join the discussion.