🌍 Public
AreaChart
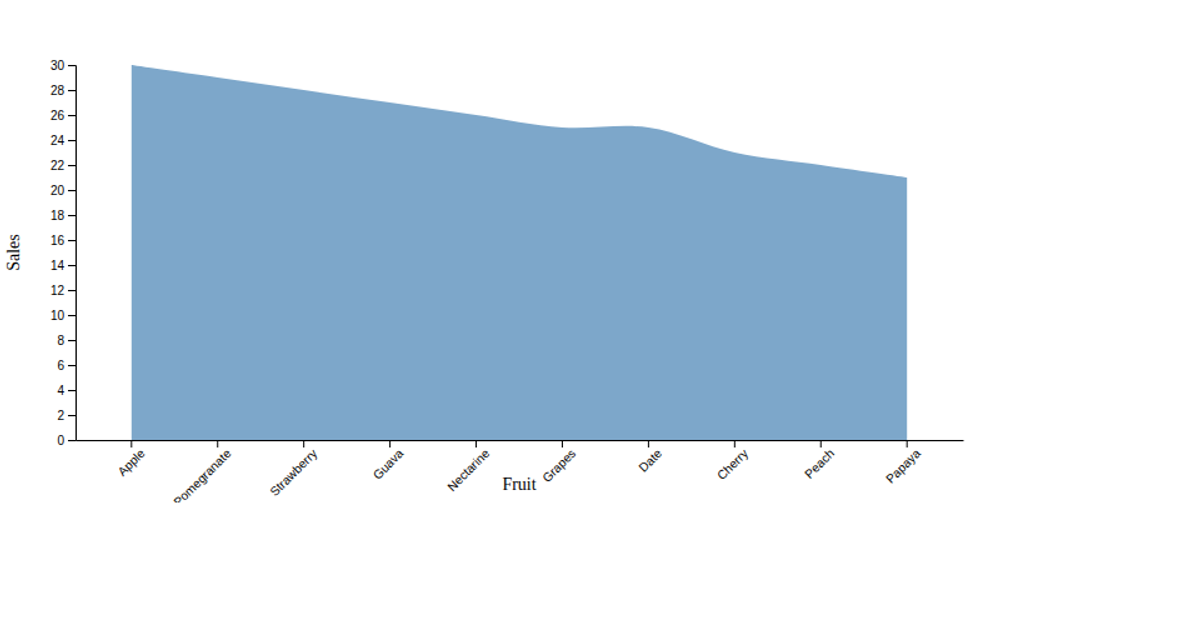
This example displays a bar chart comparing the quantities of ten different fruit categories, such as apples, bananas, and oranges. The chart uses a steel-blue fill for each bar, with a rotated x-axis label for readability and a linear y-axis to show quantity values. The visualization is built using the D3.js library, leveraging its `scaleBand` for categorical x-axis positioning, `scaleLinear` for the y-axis, and `axisBottom` and `axisLeft` for generating the axis ticks. The chart is rendered as an SVG element within a simple HTML page.
AI-generated descriptionMIT Licensed





Comments
Sign in to join the discussion.