🌍 Public
Social Network Graph by Arefa Patwary
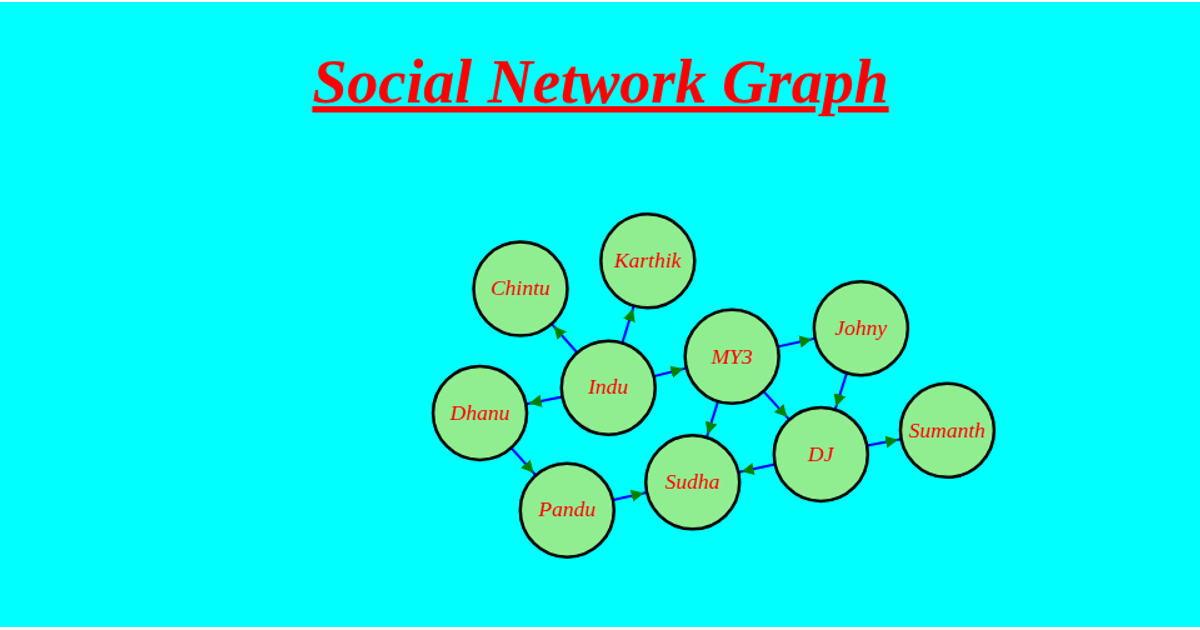
This interactive social network graph visualizes connections between individuals, with nodes representing people and links representing relationships. A force-directed simulation (d3.forceSimulation) positions the nodes, while node size and color intensity reflect each person’s degree of connectivity, computed from the link data. The graph uses SVG rendering, with draggable nodes and labeled text. The code leverages d3.forceLink, d3.forceCenter, d3.forceManyBody, and d3.drag to handle the physics and interaction, with bluescale coloring applied via d3.interpolateBlues.
AI-generated descriptionMIT Licensed




Comments
Sign in to join the discussion.