🌍 Public
Making a bar Chart
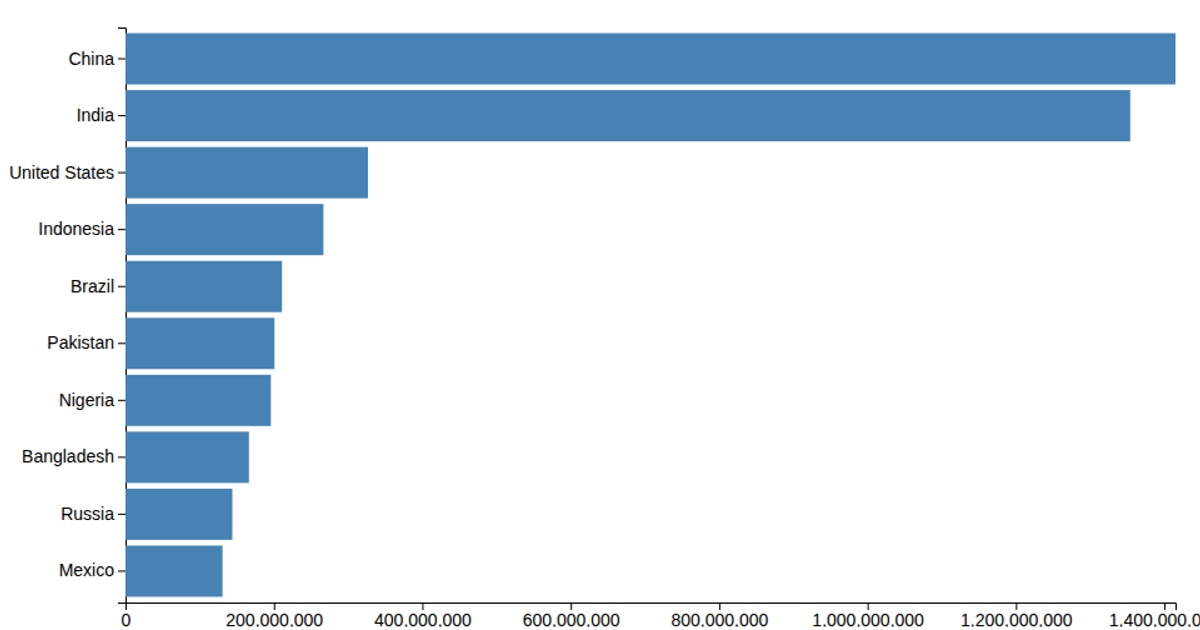
This bar chart displays the population of nine South Asian countries, sorted by country name, with population values in thousands. The visualization uses D3 v6 with SVG rendering, employing `d3.csv` to load the data, `scaleLinear` and `scaleBand` for the x and y axes, and `axisLeft` and `axisBottom` for ticks. The chart applies a custom tick format to abbreviate large numbers and includes a population axis label.
AI-generated descriptionMIT Licensed



Comments
Sign in to join the discussion.