🌍 Public
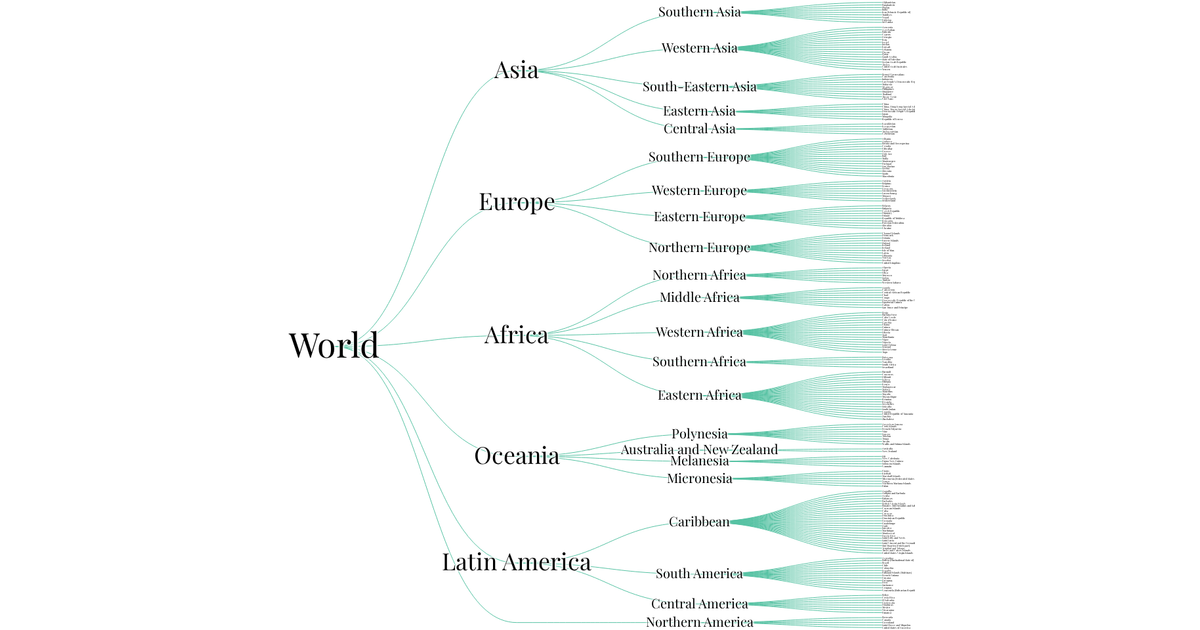
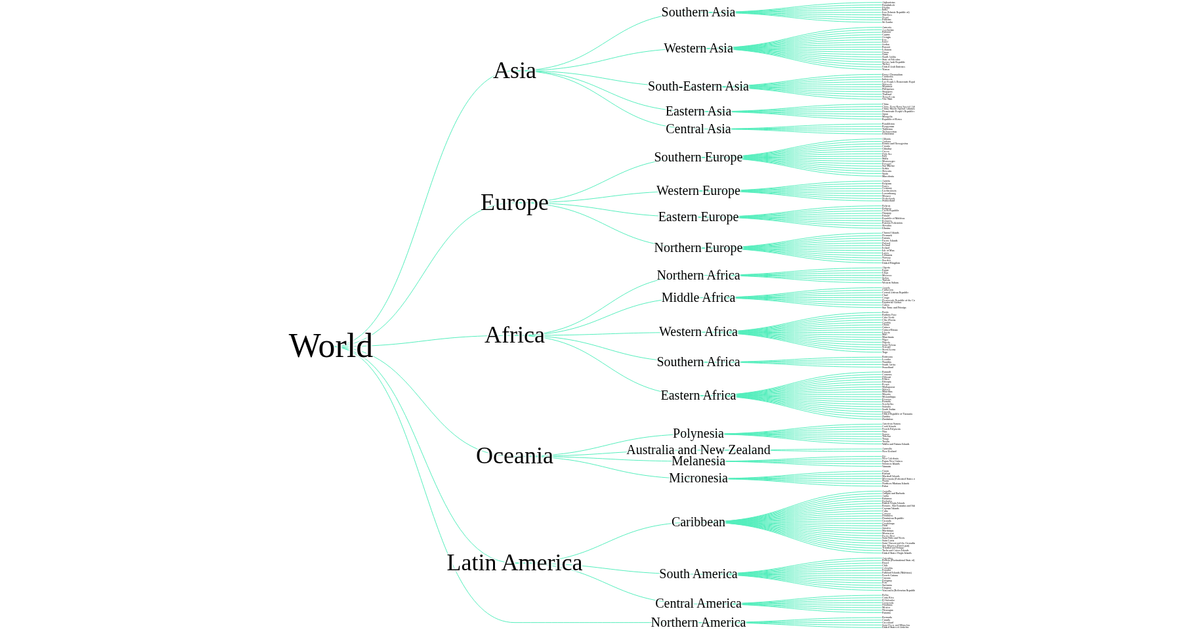
World Countries Tree
This example displays a single circle positioned at coordinates (300, 300) with a radius of 40 pixels, filled with a teal color. The visualization uses an SVG element created with D3.js v4, where the circle is appended to a group that supports zooming and panning through the `d3.zoom` API. The viewport fills the browser window, and the circle remains stationary apart from user-driven transformations. The code relies on `d3.select` to bind the SVG to a div container, with styling applied via external CSS.
AI-generated descriptionMIT Licensed



Comments
Sign in to join the discussion.