🌍 Public
BigQuery Bar Chart
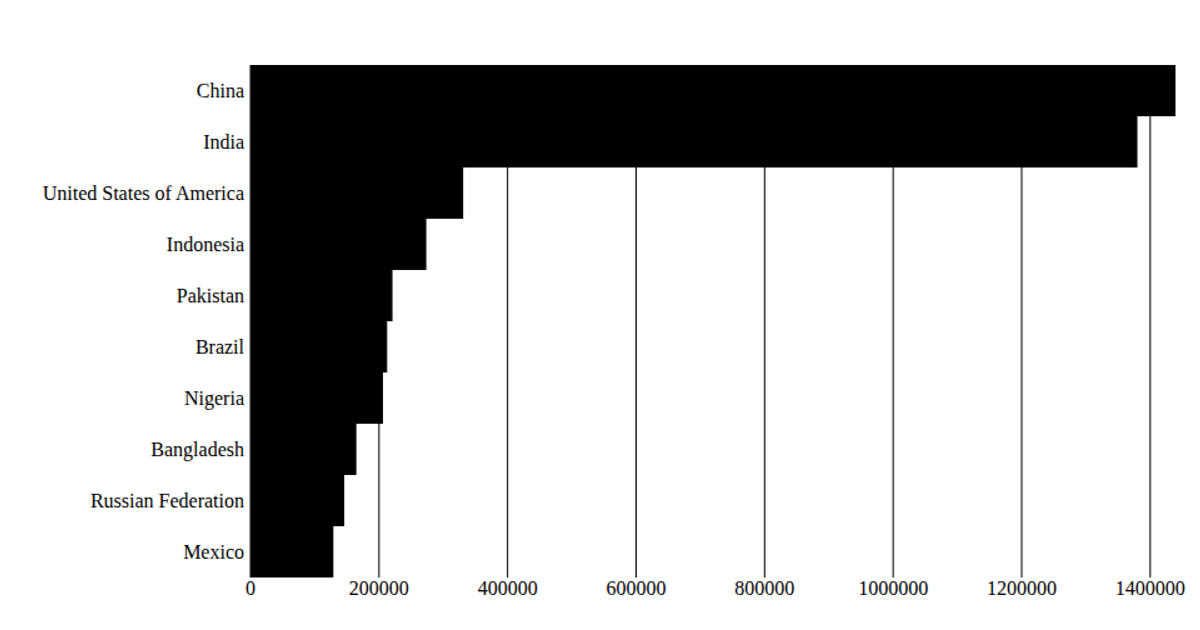
This chart displays the number of characters in the first ten edits to a Wikipedia page, plotted as bars over time. It uses React with D3's `scaleLinear` and `scaleBand` to map date-time values on the x-axis and character counts on the y-axis, rendering SVG rectangles. Data is loaded via `d3.csv` from a gist URL, and date parsing uses `timeParse`. The axes are custom-built with D3’s `scaleLinear` ticks, and the visualization is updated only once when the data loads.
AI-generated descriptionSimple time series bar chart
MIT Licensed



Comments
Sign in to join the discussion.