🌍 Public
Cheap tricks for MAP interaction with D3.js
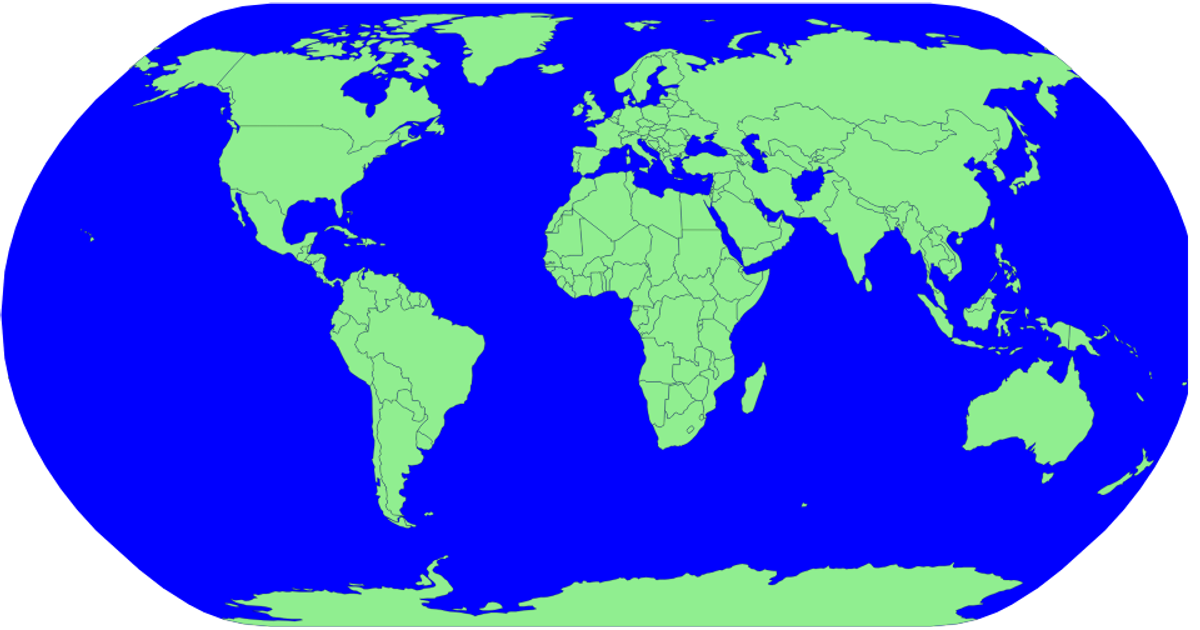
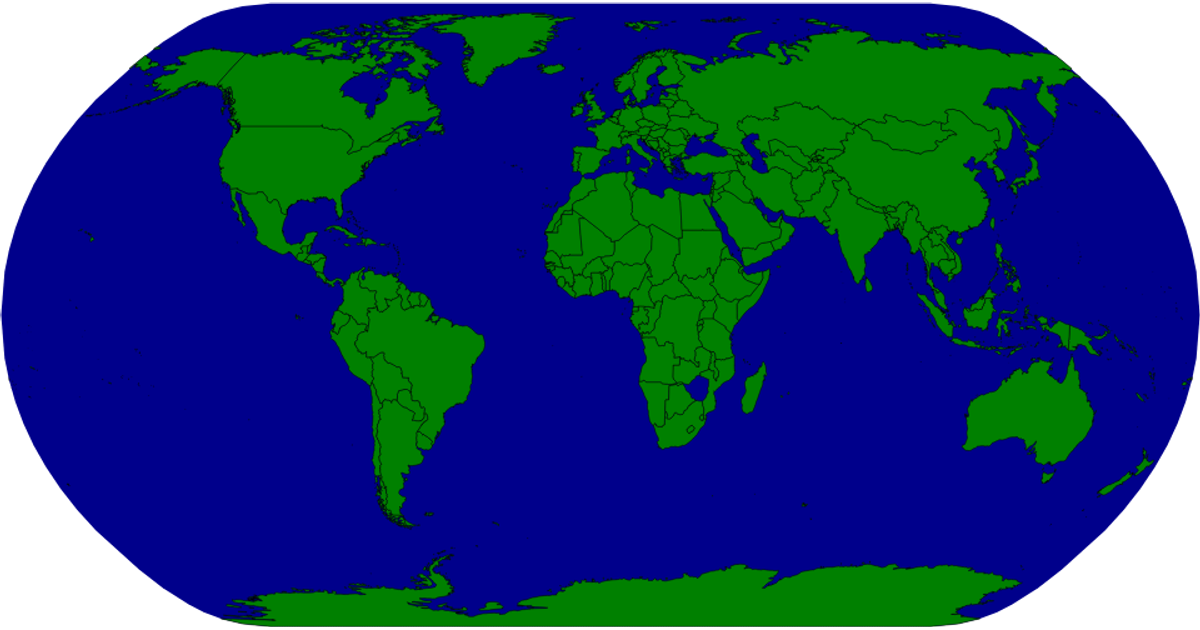
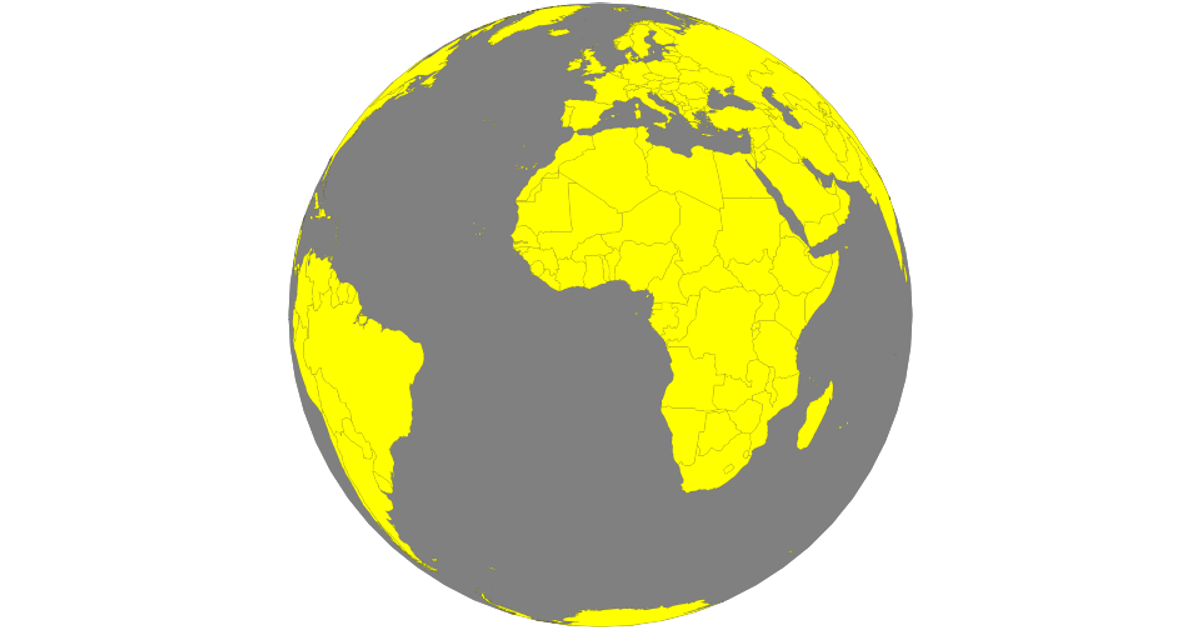
This visualization demonstrates interactive choropleth map interactions using D3.js, displaying world countries with hover effects that highlight regions in red. The map supports zooming and panning through the `zoom` API, with multiple projection options including `geoMercator`, `geoOrthographic`, and `geoStereographic` for varied geographic representations. Country boundaries are rendered as SVG paths using `geoPath`, populated with data from the world-atlas package, while country names are matched via TSV metadata.
AI-generated descriptionMIT Licensed





Comments
Sign in to join the discussion.