🌍 Public
Scatter Plot for Iris Data
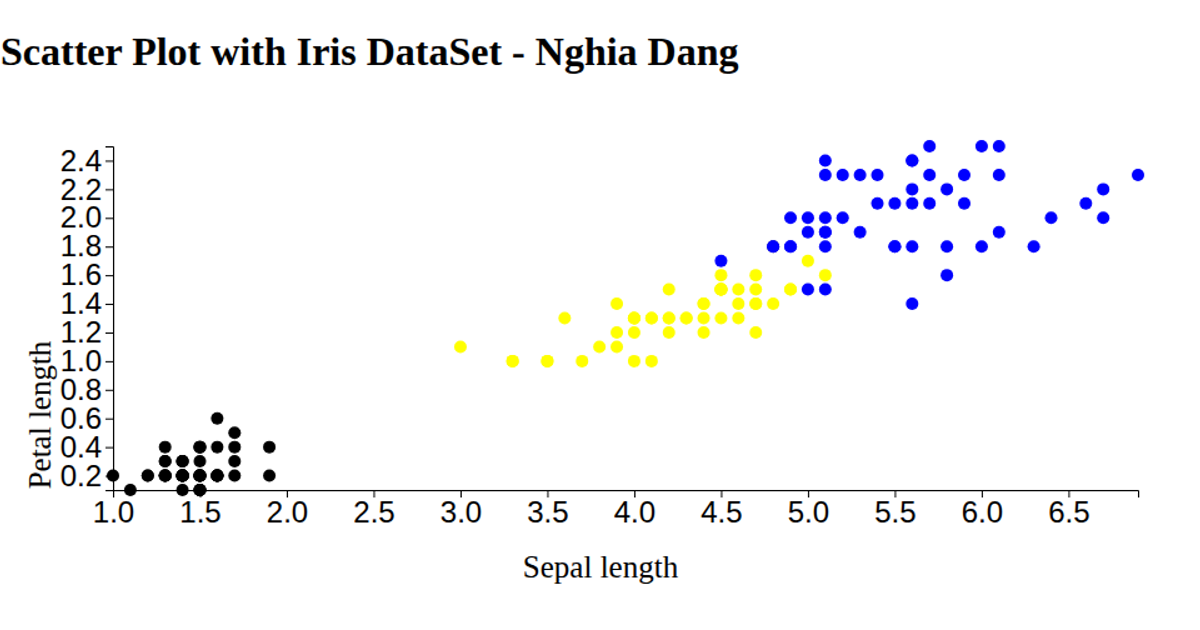
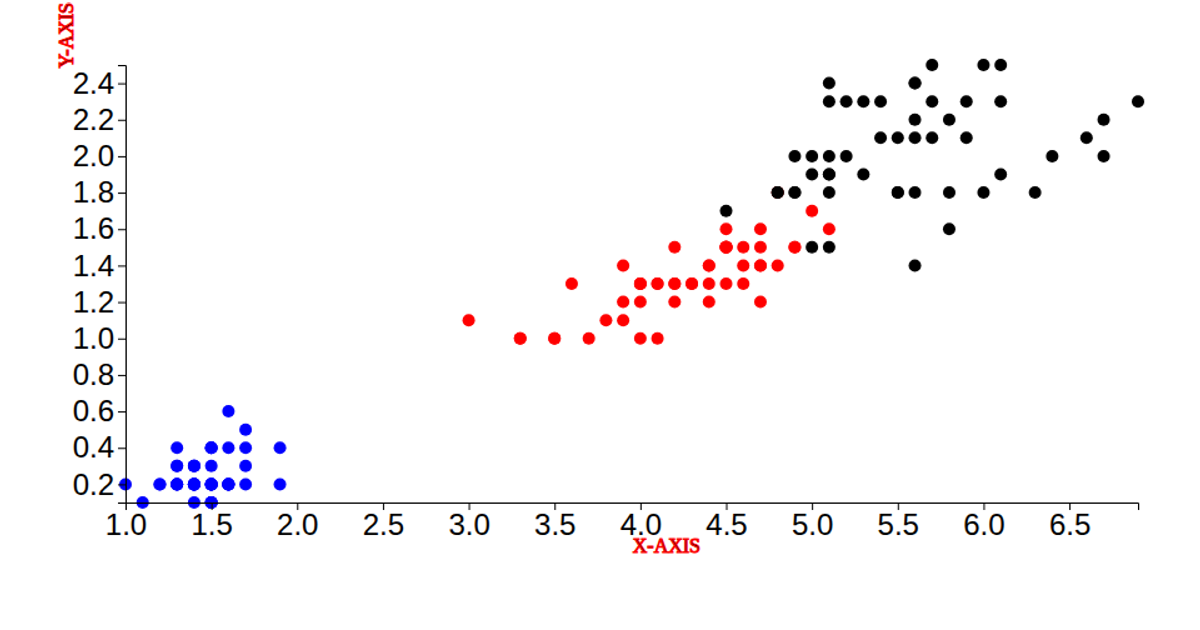
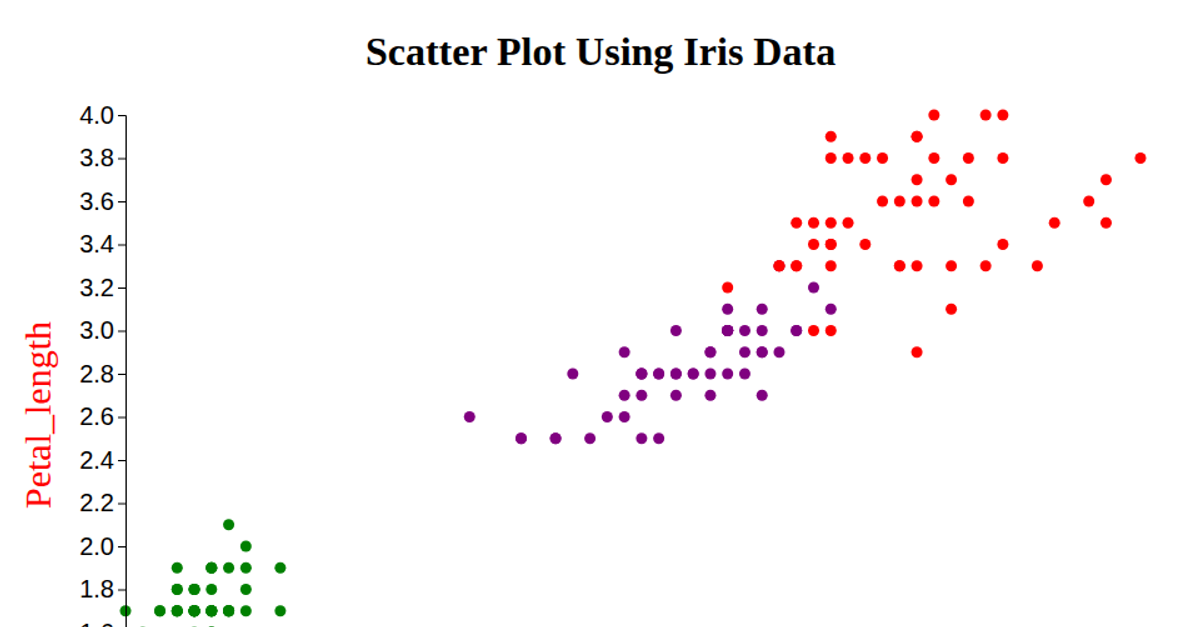
This example renders the classic Iris dataset as a scatter plot using D3 v6. It maps petal length and petal width to the x and y axes, coloring each point by species (setosa, versicolor, or virginica) with yellow, pink, or blue fills. The dataset is loaded via `d3.csv` from a GitHub raw URL, with numeric parsing of all measurements. Axes are generated with `d3.axisLeft` and `d3.axisBottom`, using `d3.scaleLinear` and `d3.extent` to set domains based on the data.
AI-generated descriptionA vanilla HTML implementation of a D3 scatter plot. Shows the Iris Dataset.
MIT Licensed





Comments
Sign in to join the discussion.