🌍 Public
Activity6_Question1.2
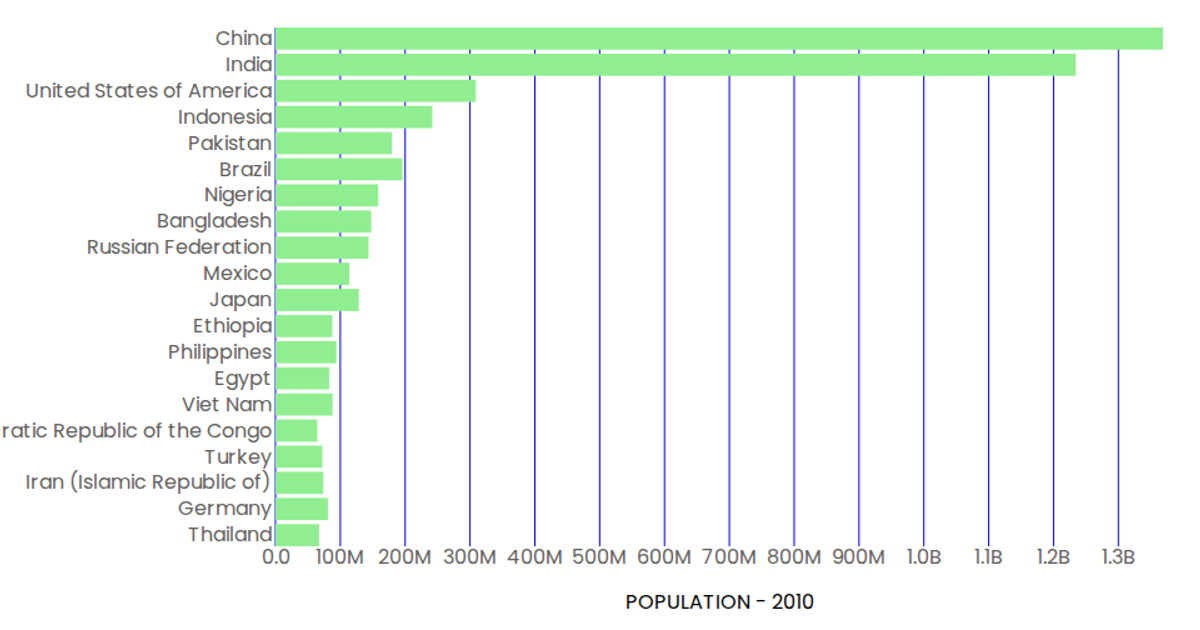
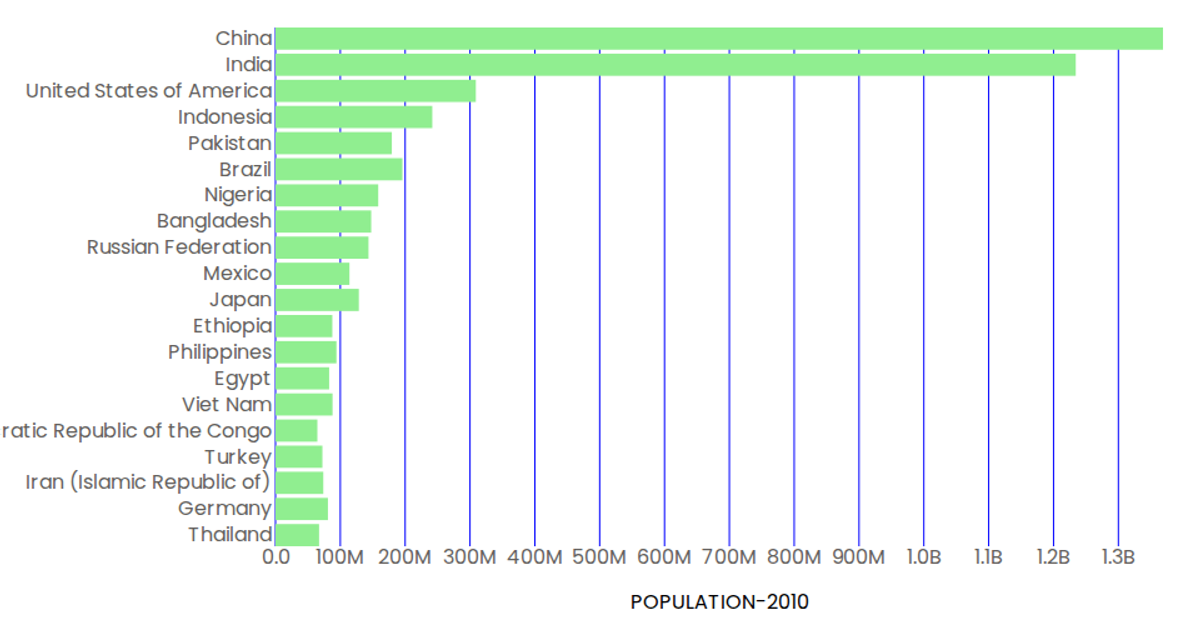
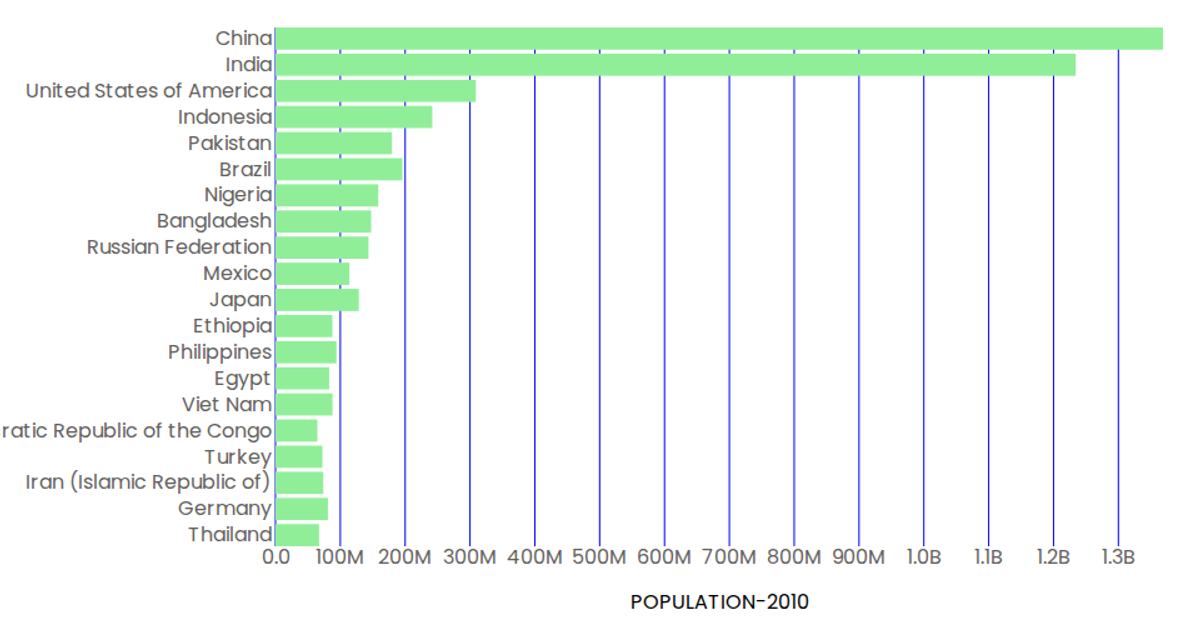
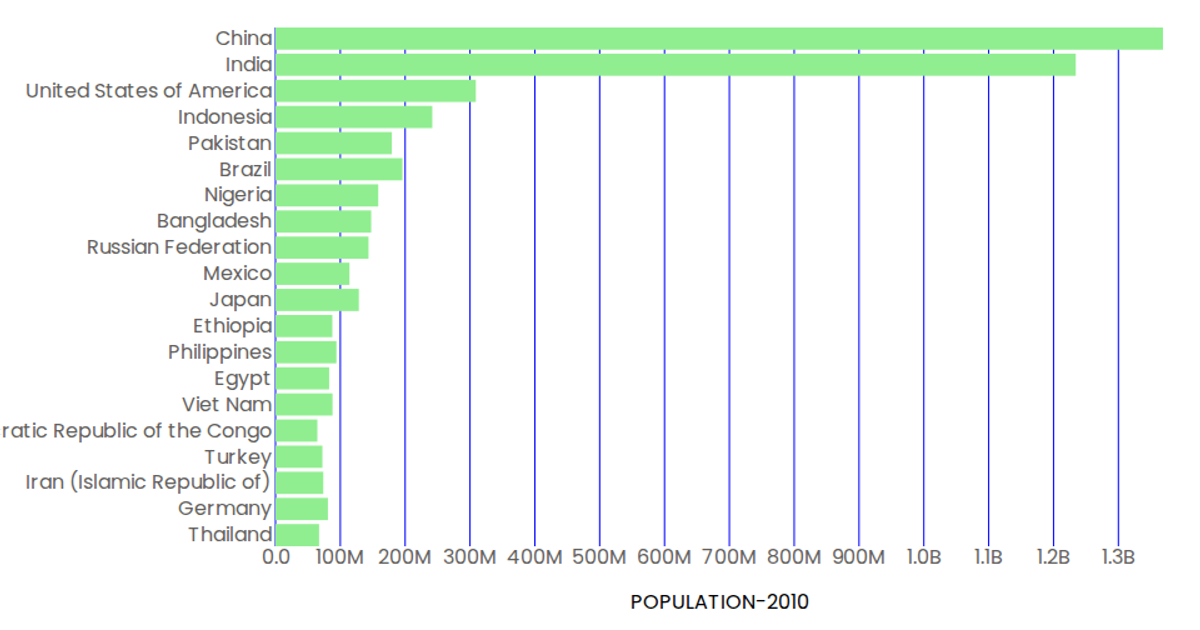
A horizontal bar chart displays the 2010 population for 20 countries, sorted by a categorical country axis. Each red bar’s length encodes population values using a linear scale, with hover tooltips formatted as billions. The React app loads CSV data via `d3.csv` and renders SVG marks with `scaleBand` and `scaleLinear`. Axes are custom components using D3’s tick generation.
AI-generated descriptionAn example showing the capabilities of VizHub:
- Loads D3 via UNPKG.
- Demonstrates use of
importfrom"d3". - Demonstrates use of
importfrom local ES6 modules.
MIT Licensed




Comments
Sign in to join the discussion.