🌍 Public
Fork of DVS SOTI Challenge Data
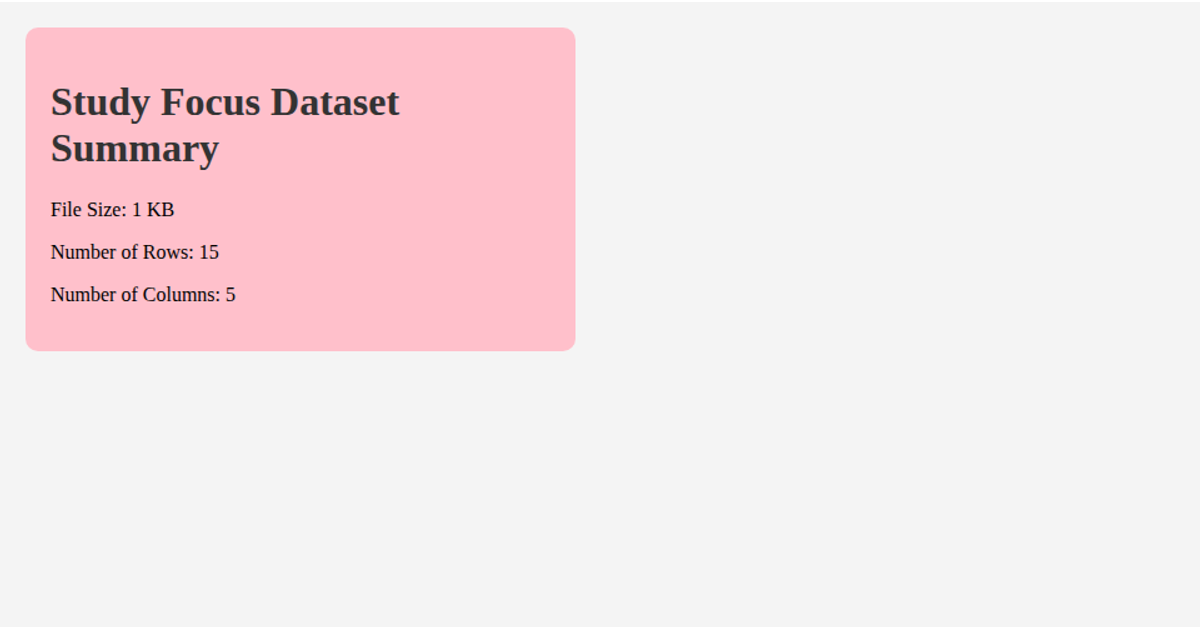
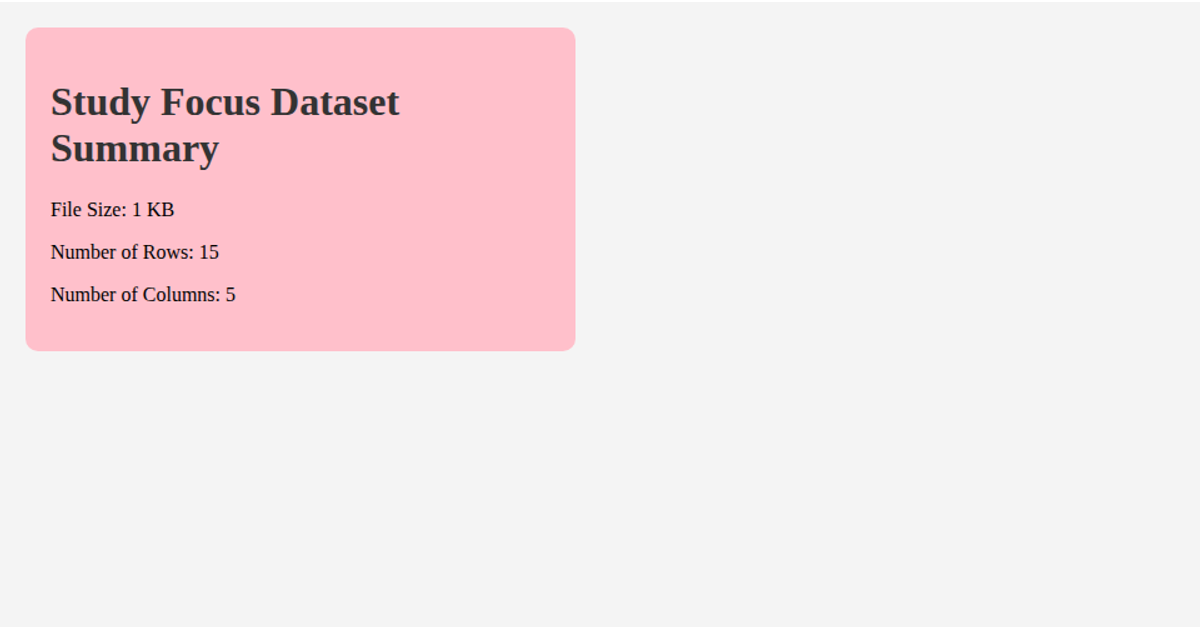
This example displays the raw contents of the first data table from a CSV import, presenting a JSON string of the first row in a large monospace font. The code imports the `test.csv` file using a static ES module import, while other dataset files are commented out for potential inclusion. The React-based visualization renders the parsed data preview into a container using a template literal, showing the table structure with its rows and columns.
AI-generated descriptionMIT Licensed






Comments
Sign in to join the discussion.