🌍 Public
User-cause-graph
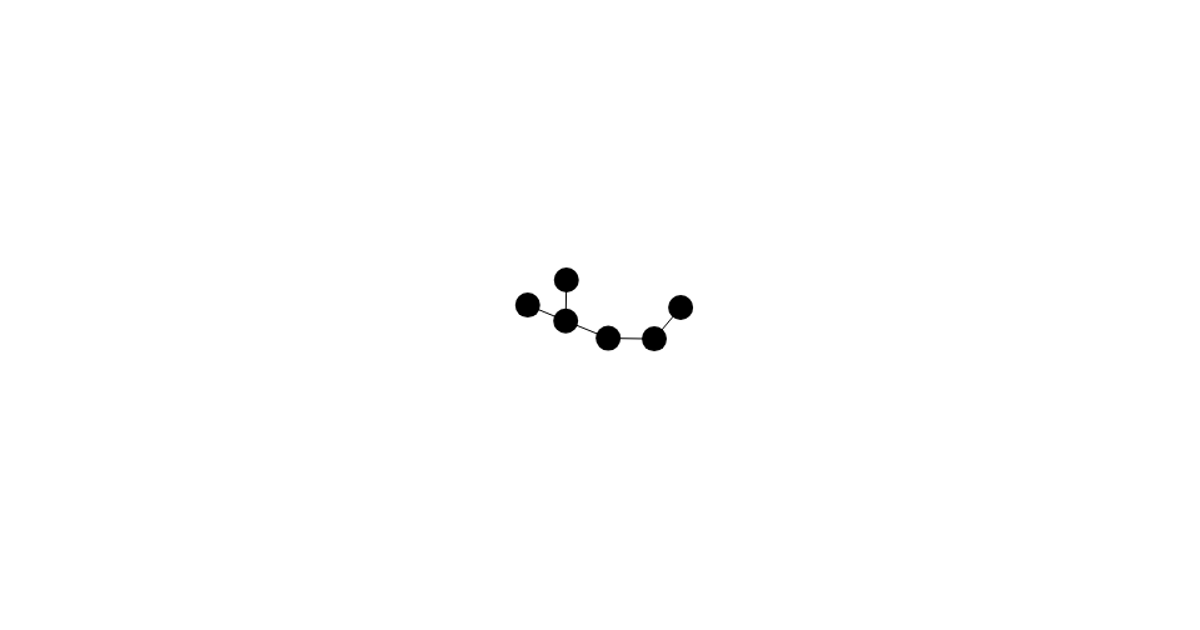
This visualization shows a network of cause nodes (such as hunger and education) connected to user nodes, with nested child users extending from each main user. The graph is built with D3’s `forceSimulation` API, applying `forceManyBody`, `forceLink`, and `forceCenter` to position nodes. Nodes are rendered as SVG circles with color-coded labels, and links are drawn as lines. The data is generated programmatically in `data.js`, which defines node sizes, distances, and connections, with interactions supporting drag-and-drop via the `drag` interaction.
AI-generated descriptionMIT Licensed



Comments
Sign in to join the discussion.