🌍 Public
Homework 2
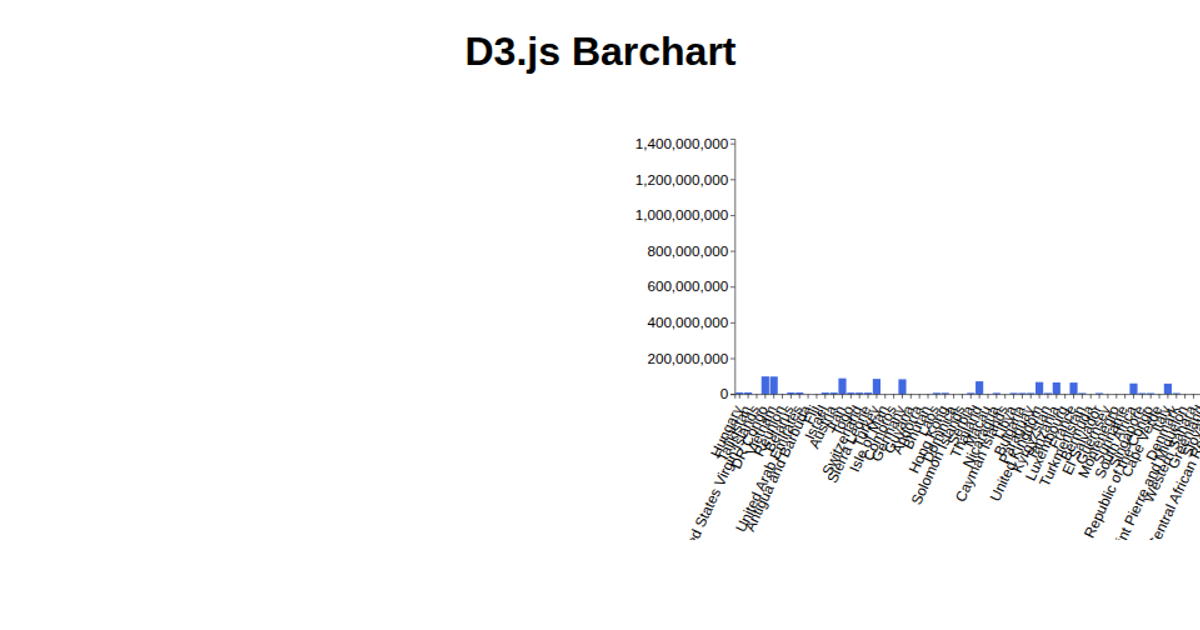
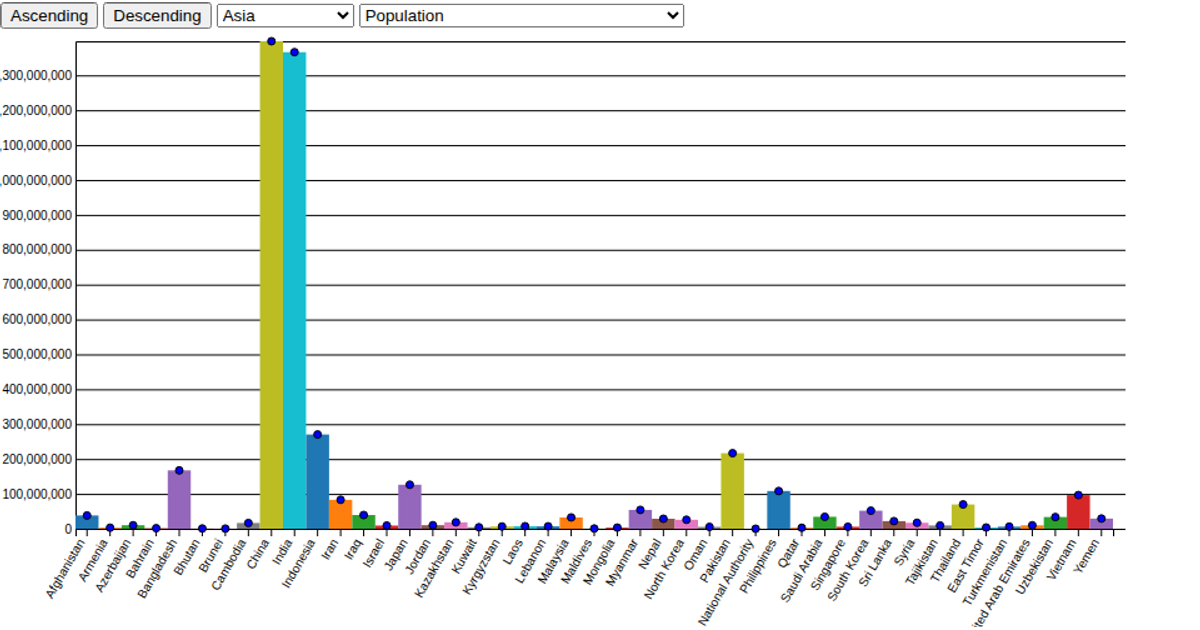
A dropdown menu lets viewers select one of five countries from a dataset of female and male employment rates. The D3.js code loads two CSV files and renders a lollipop chart designed to compare female and male employment rates across time for the chosen country. The chart is drawn using `d3.select` to target an SVG element, and the interaction is triggered by a button that calls the `drawLolliPopChart` function, which is implemented to update the visualization based on the selected country.
AI-generated descriptionA demonstration of how to start using D3 version 6.
MIT Licensed




Comments
Sign in to join the discussion.