🌍 Public
network representation of data
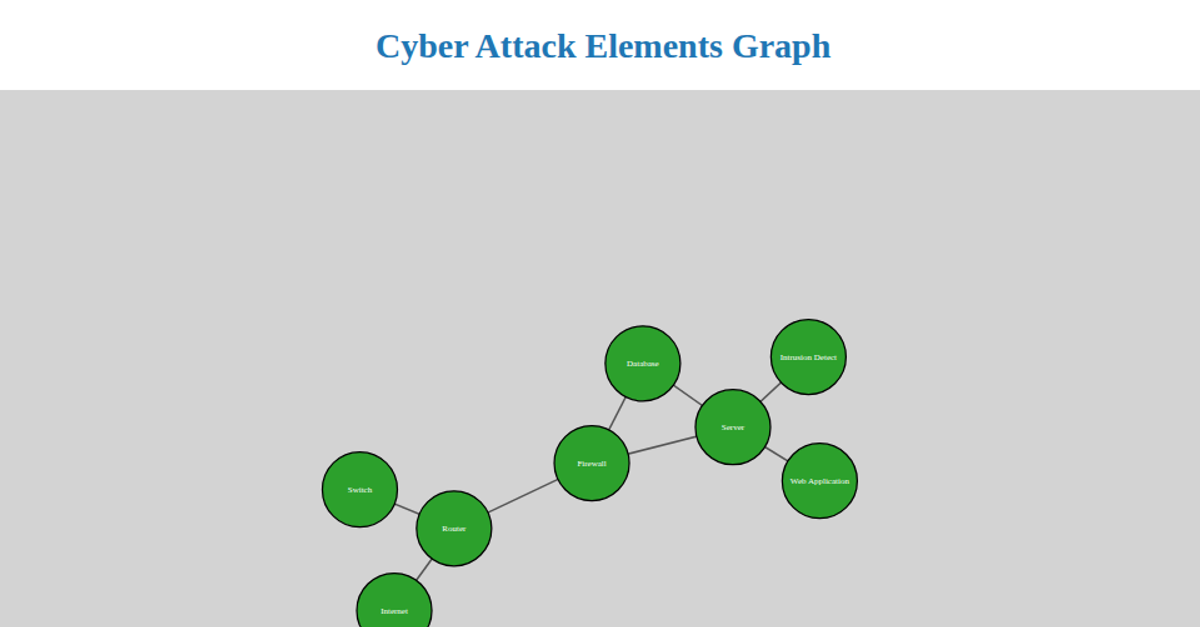
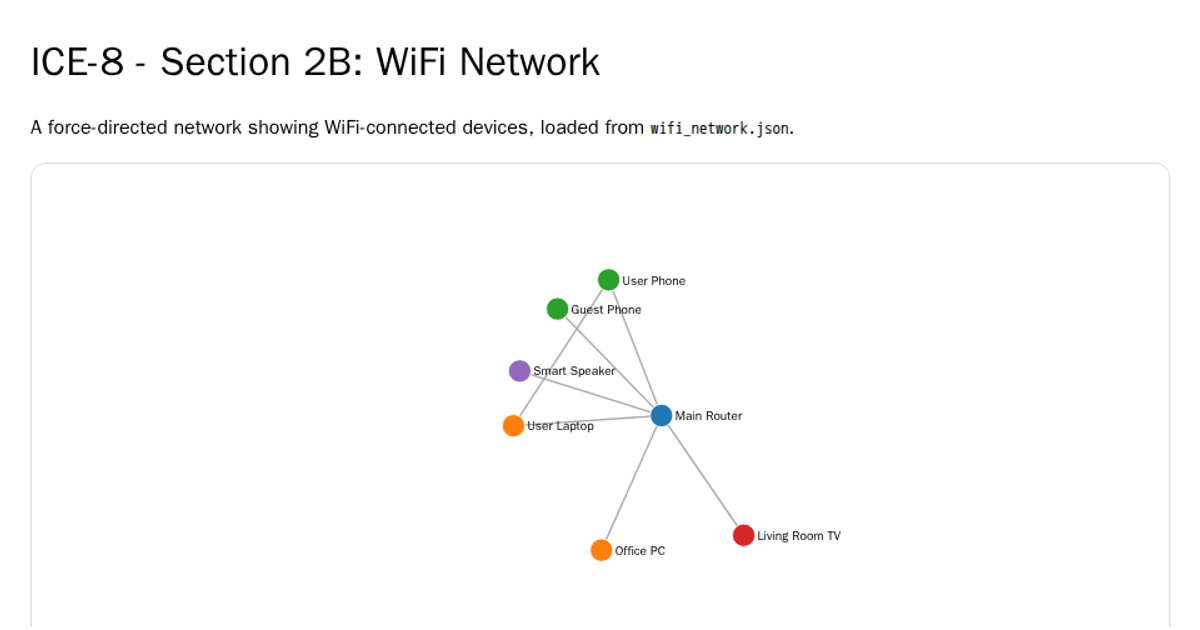
This interactive D3.js network graph maps IoT device types to their associated attack vectors, using a force-directed layout to position nodes. Nodes represent either devices (orange) or attack types (teal), with links showing connections like a Camera linked to Phishing and Brute Force. The visualization is built with `d3.forceSimulation` and its `d3.forceLink`, `d3.forceManyBody`, and `d3.forceCenter` components, rendered as an SVG with draggable circles and labels. Data is hardcoded in the script, and the color-coding distinguishes device nodes from attack nodes.
AI-generated descriptionMIT Licensed


Comments
Sign in to join the discussion.