🌍 Public
Algorithm Results Evaluation
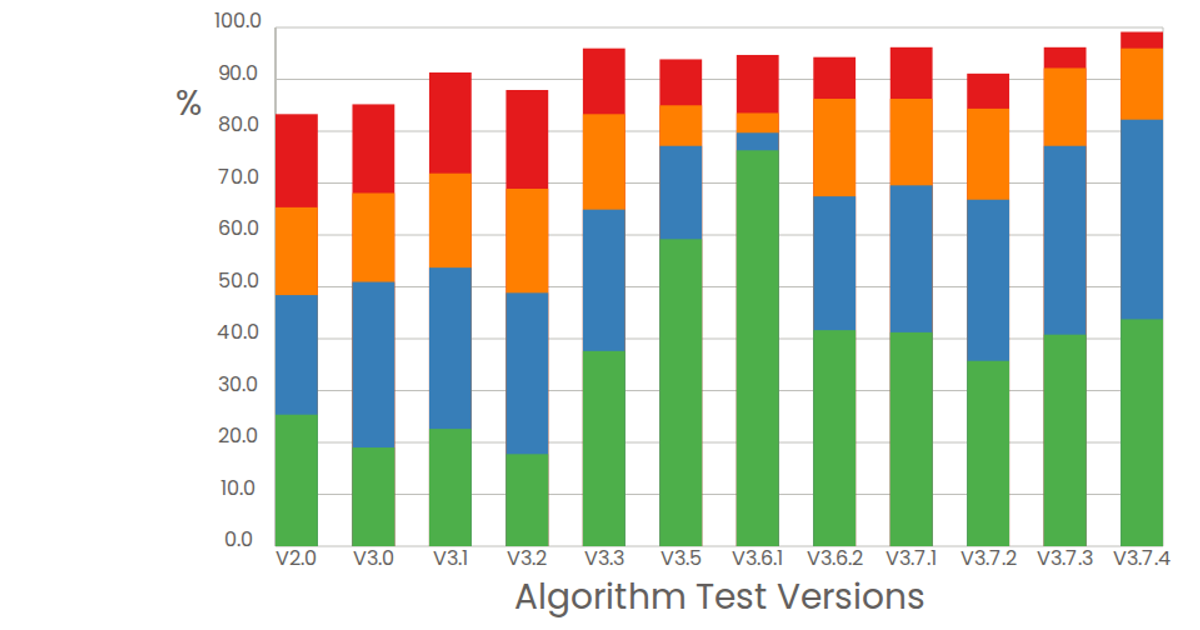
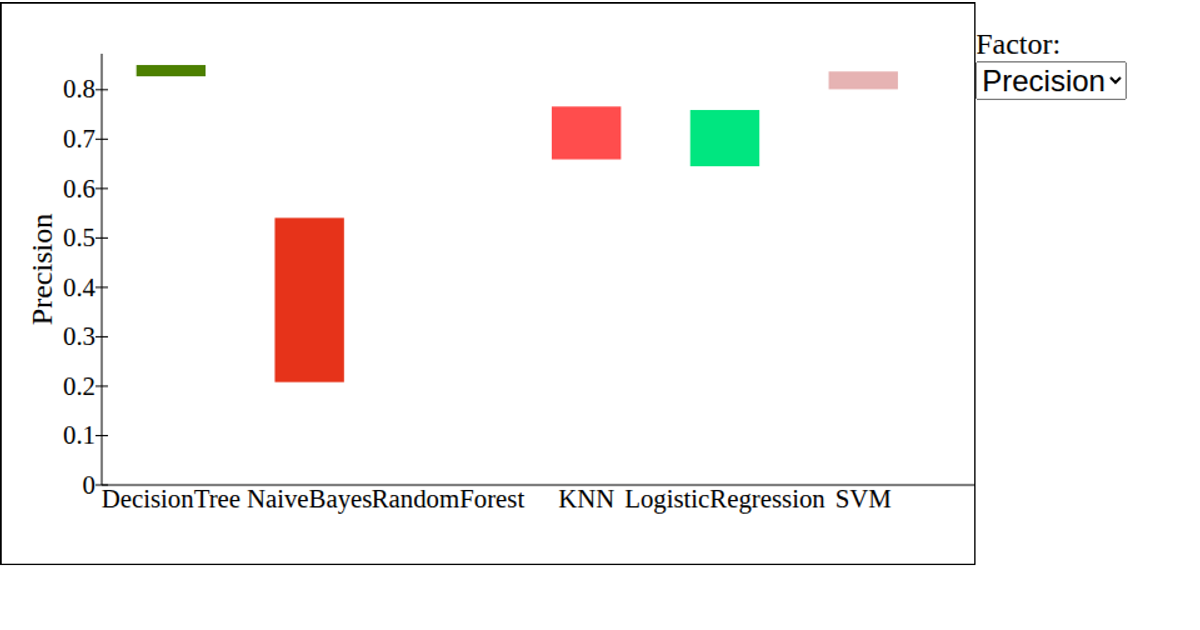
This example shows a grouped bar chart evaluating algorithm test versions by four outcome categories—High, Mid, Low, and Base—as percentages on a 0–100 scale. The React-based visualization uses d3.scaleBand for the categorical x-axis and d3.scaleLinear for the y-axis, with each version rendered as four colored rectangles via SVG. Data is loaded as CSV through d3.csv, with the first twelve rows displayed and a fixed y-domain emphasizing relative performance.
AI-generated descriptionA test.
Data: Algorithm Results Evaluation.
MIT Licensed




Comments
Sign in to join the discussion.