🌍 Public
harsha act6 que4
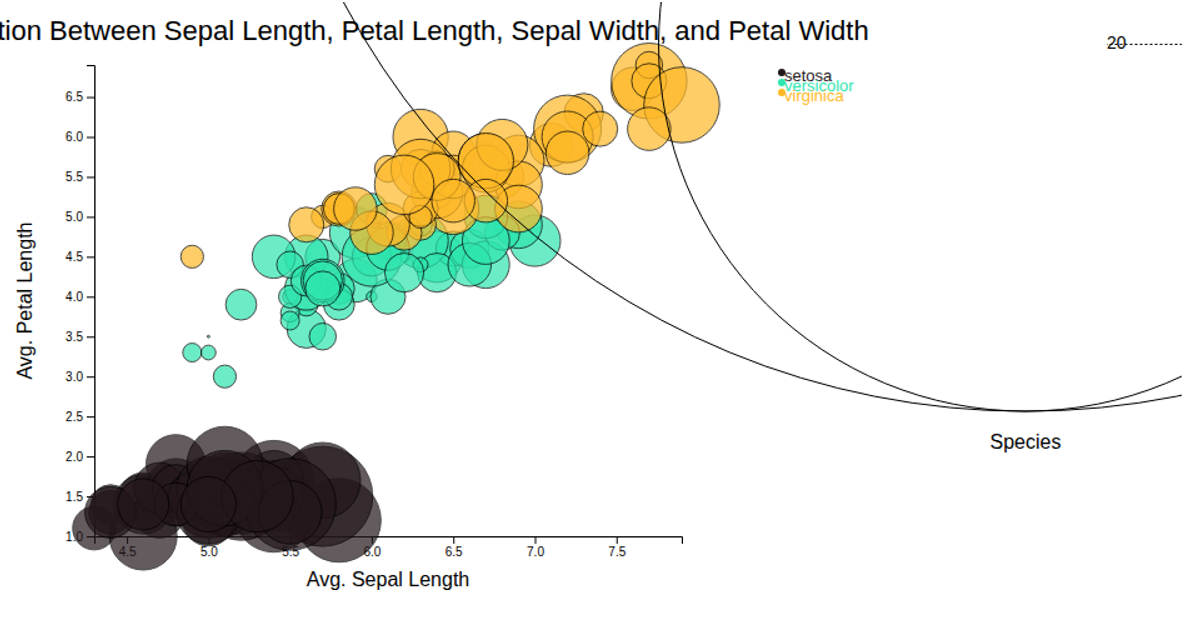
This bubble chart visualizes correlations among sepal length, sepal width, and petal length for the classic Iris dataset. It uses d3.csv to load the data, then d3.scaleLinear for axes and bubble sizing, with d3.scaleOrdinal mapping species to colors from d3.interpolateTurbo. Hovering over a bubble triggers tooltips showing species and petal length, while a legend identifies species colors. The SVG rendering includes axis labels and a chart title.
AI-generated descriptionMIT Licensed


Comments
Sign in to join the discussion.