🌍 Public
haneesh reddy
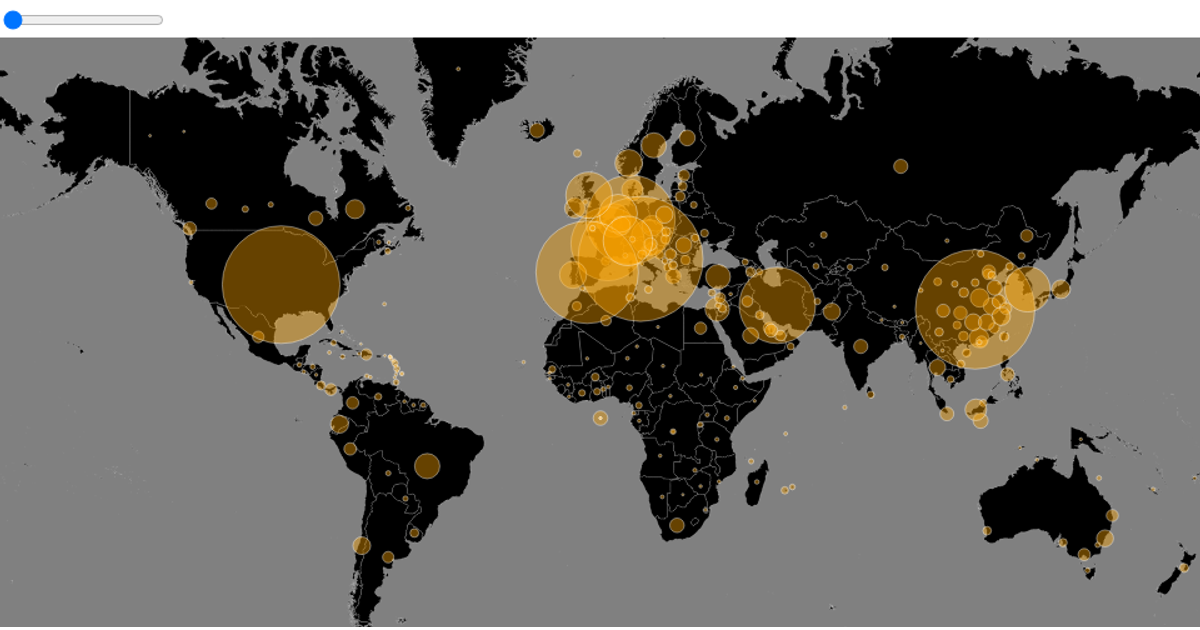
This interactive map shows the global spread of COVID-19 cases over time. The visualization renders a world map using `d3.geoPath` and `d3.geoMercator` from the d3 library, with circles representing reported cases per country, sized using `d3.scaleSqrt`. A slider allows browsing through the date range, with data parsed from a CSV file. The implementation uses d3.v5 and topojson to process geographic data, and the date slider updates the display.
AI-generated descriptionMIT Licensed



Comments
Sign in to join the discussion.