🌍 Public
World Adult Obesity
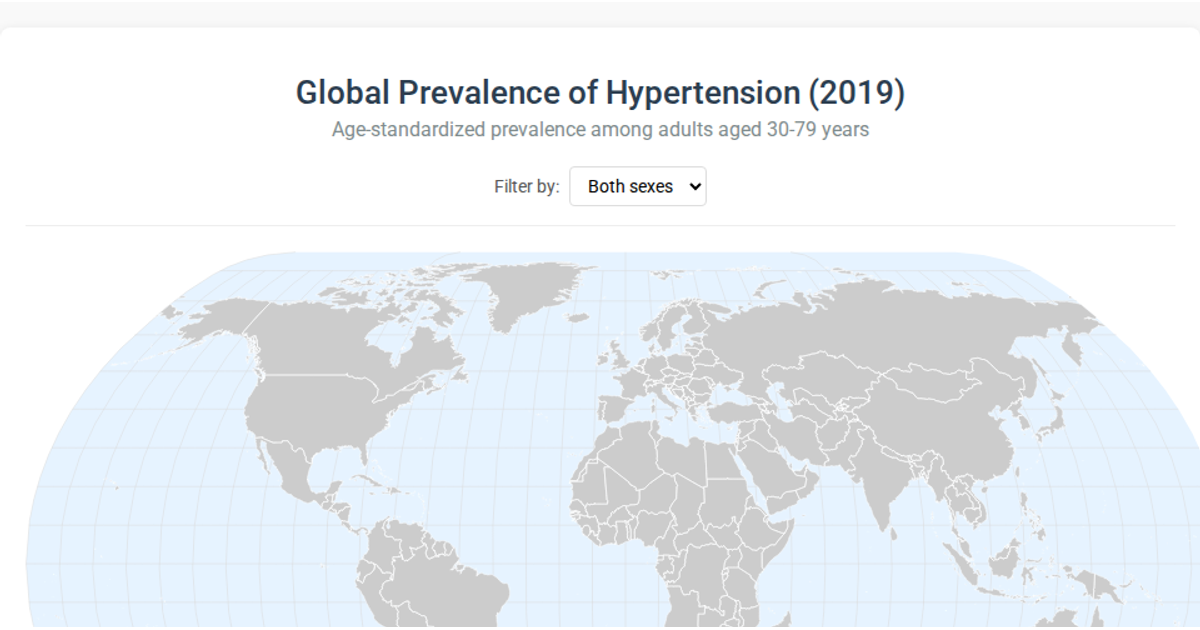
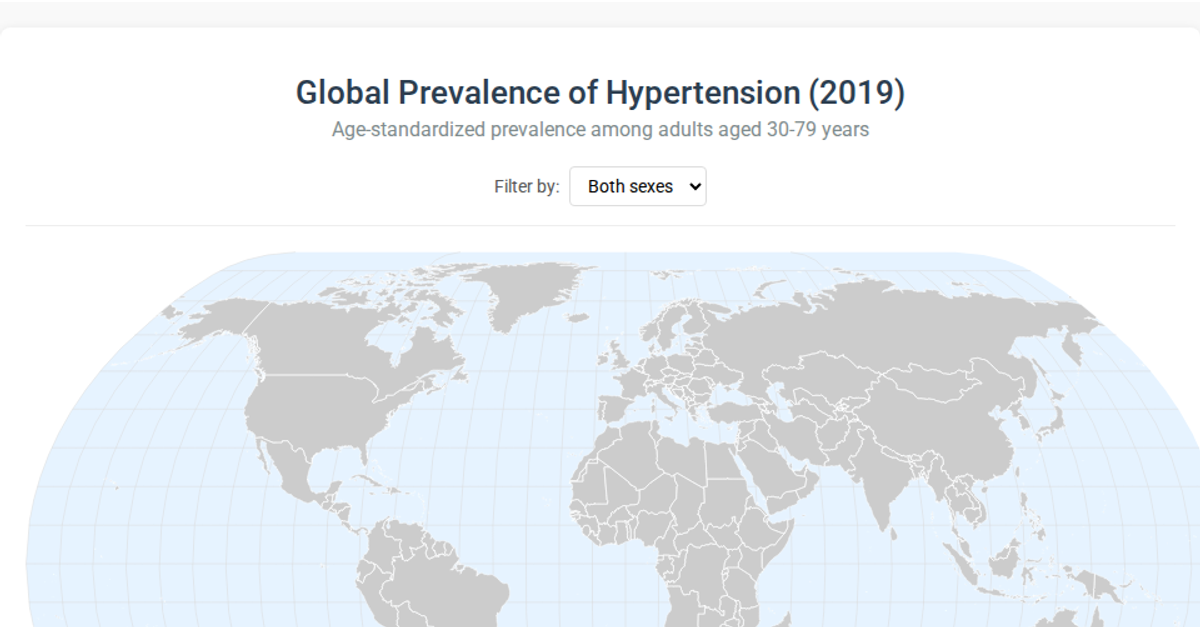
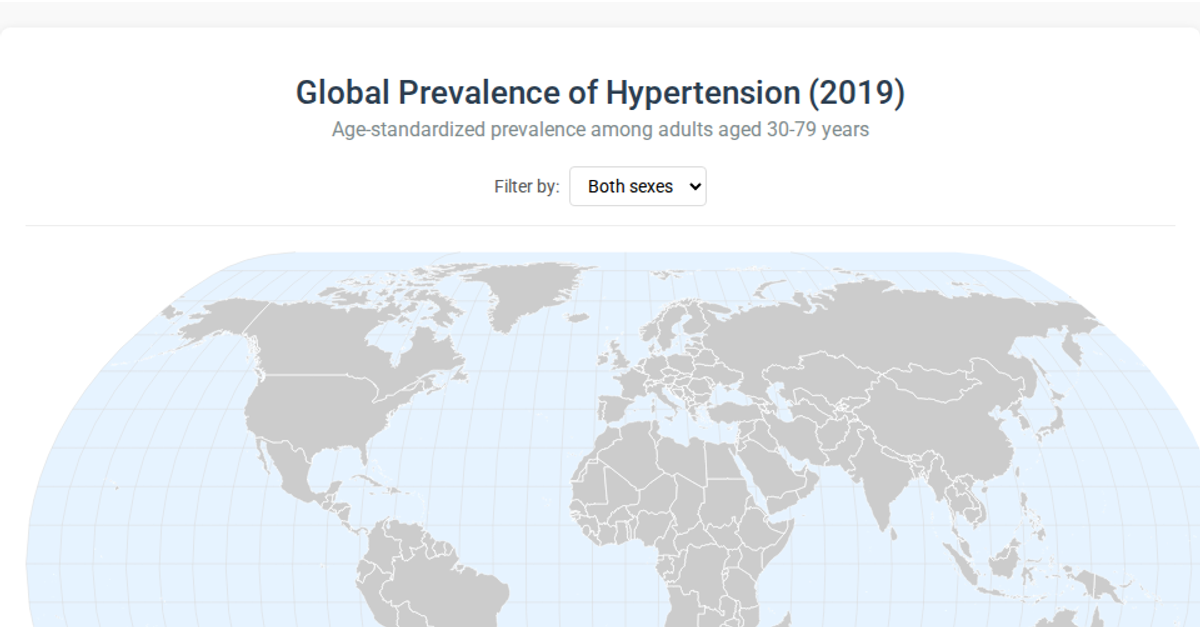
A heat map of global adult obesity rates uses color-coded countries on a world map to show prevalence by year. Users can scrub through available years for smooth transitions or input a specific year, with pop-ups on hover providing country details and a legend describing the color scale. It is rendered as SVG via D3 v5, using d3.min.js for selection and shape drawing, with data loaded from a static CSV.
AI-generated descriptionThis will be a heat map of world obesity percentages, allowing user to scrub through the year ranges available. Will create a smoothe transition as user scrubs. Allows user input of year to view rate. Hovering over country will trigger a pop-up with additional country details. Legend at the bottom to descibe the "heat" map coloring.
MIT Licensed





Comments
Sign in to join the discussion.