🌍 Public
ICE_6_Penguin_Data_Set_Scatter_Plot_Loki
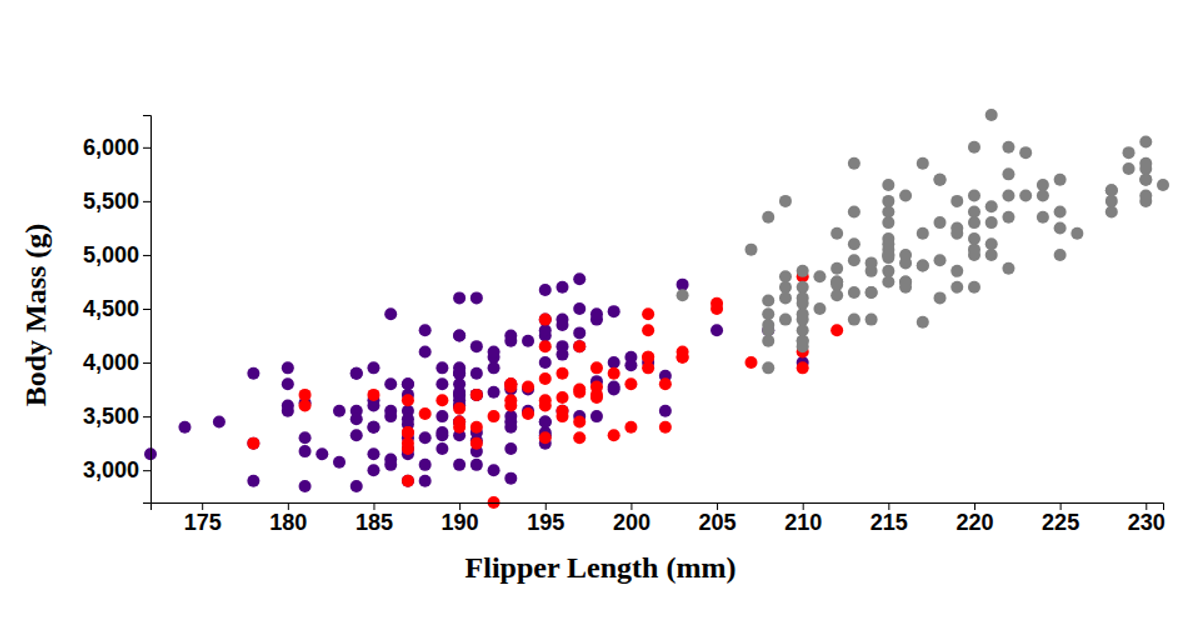
This scatter plot visualizes the Palmer Penguins dataset, showing flipper length on the x-axis and body mass on the y-axis, with points colored by species (Adelie, Chinstrap, and Gentoo). It also encodes culmen length and depth as properties in the data, though circles render with a fixed radius. Built with React and D3 v5, the code uses `csv` to load the data, `scaleLinear` for axes, and `axisLeft`/`axisBottom` for tick marks. SVG circles are joined to the data with `selectAll` and `join`, while the title and axis labels are styled with cursive fonts.
AI-generated descriptionA bare minimum HTML page demonstrating use of CSS and JavaScript.
See also React Starter.
MIT Licensed




Comments
Sign in to join the discussion.