🌍 Public
ICE 8 - Avinash Chinta
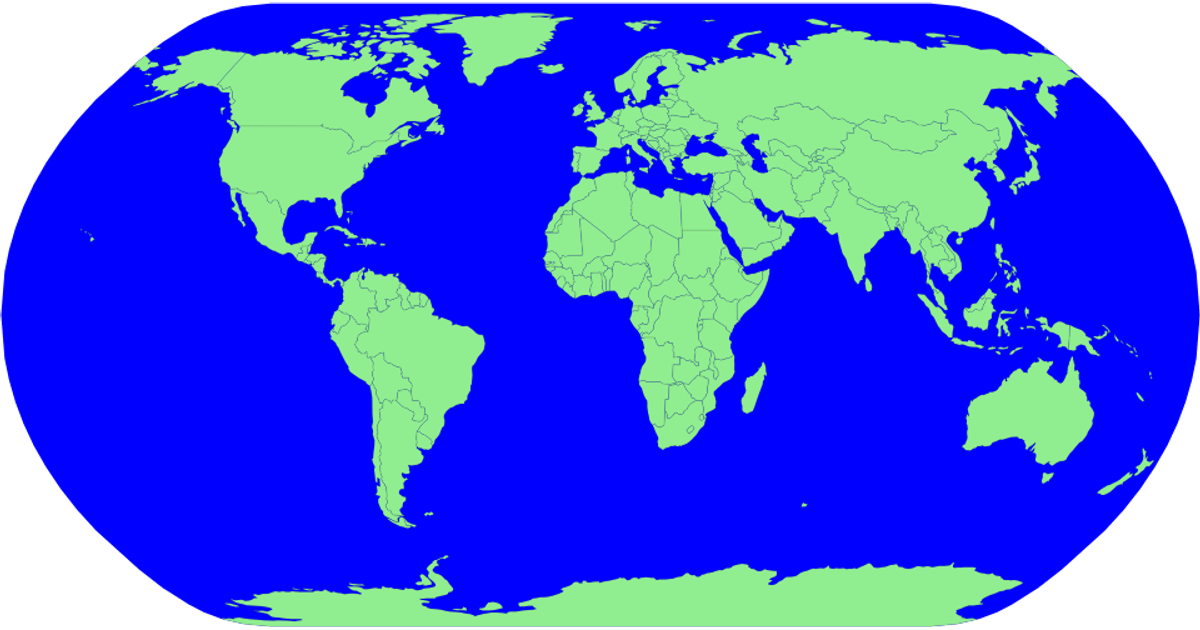
This visualization displays a world map using a natural Earth projection, with countries rendered as a single-color choropleth. The sphere background is filled in yellow-green, while each country is drawn in a contrasting green with black outlines. The code imports D3 v5 functions like `geoNaturalEarth1`, `geoPath`, and TopoJSON’s `feature` to parse geographic data from a GitHub-hosted JSON file and generate SVG paths for all countries.
AI-generated descriptionMIT Licensed




Comments
Sign in to join the discussion.