🌍 Public
Sized Points on a Map
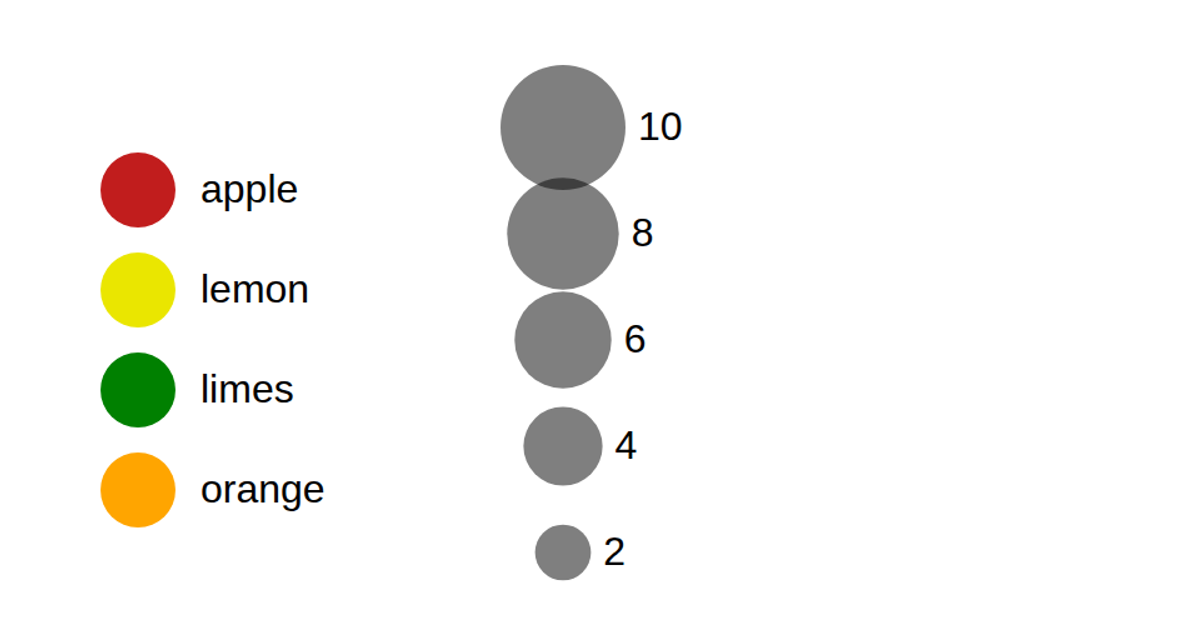
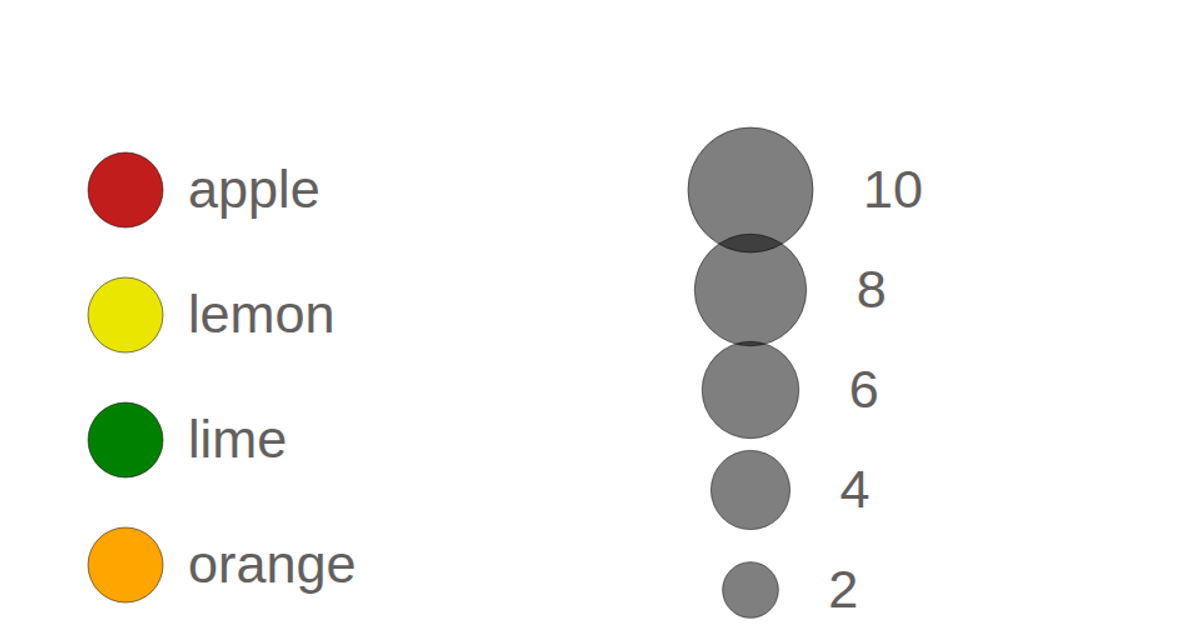
Two legends demonstrate how to encode data with color and size scales on an SVG map. The color legend uses a `d3.scaleOrdinal` to map fruit categories to distinct colors, while the size legend applies a `d3.scaleSqrt` to represent numeric values through circle radii. Both legends are rendered with custom functions, `colorLegend` and `sizeLegend`, which append groups containing circles and text labels.
AI-generated descriptionMIT Licensed




Comments
Sign in to join the discussion.