🌍 Public
Design of scatter plot
Nnagarjuna1968
Last edited Mar 27, 2022
Created on Mar 27, 2022
Forked from ICE - 7 Reusable Scatter Plot Maanas Katta
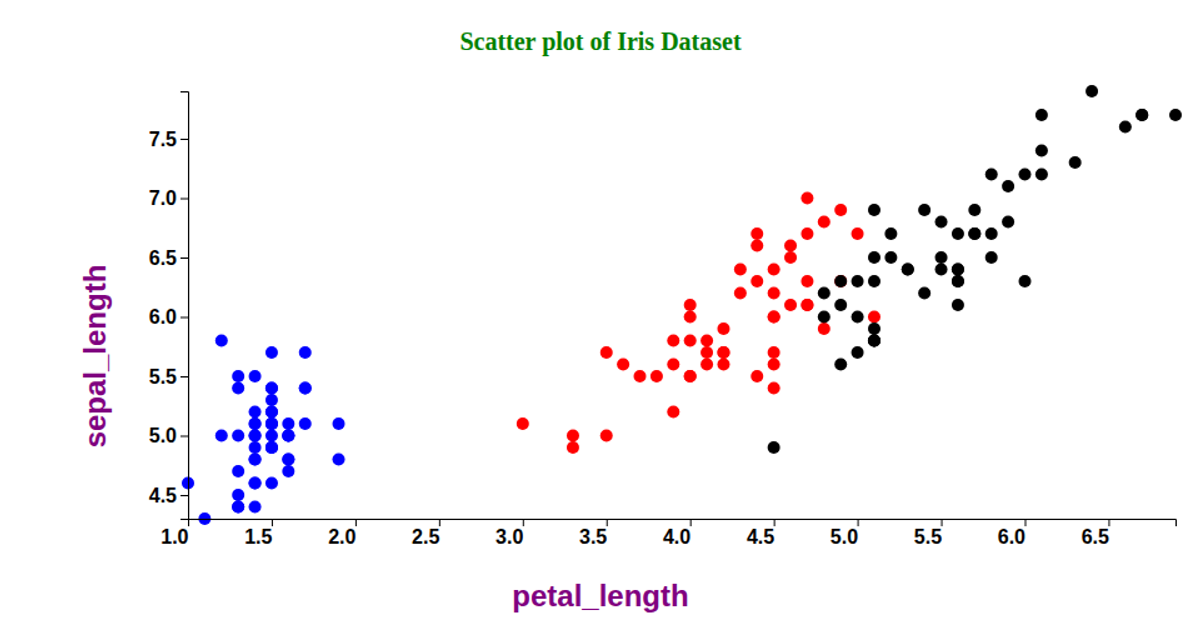
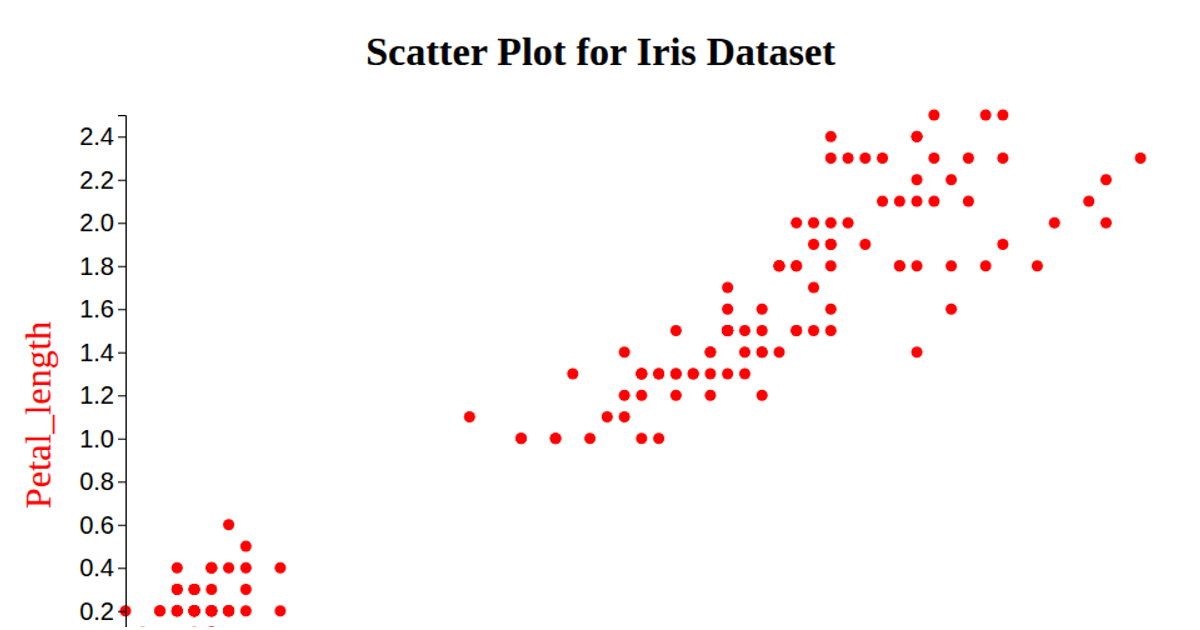
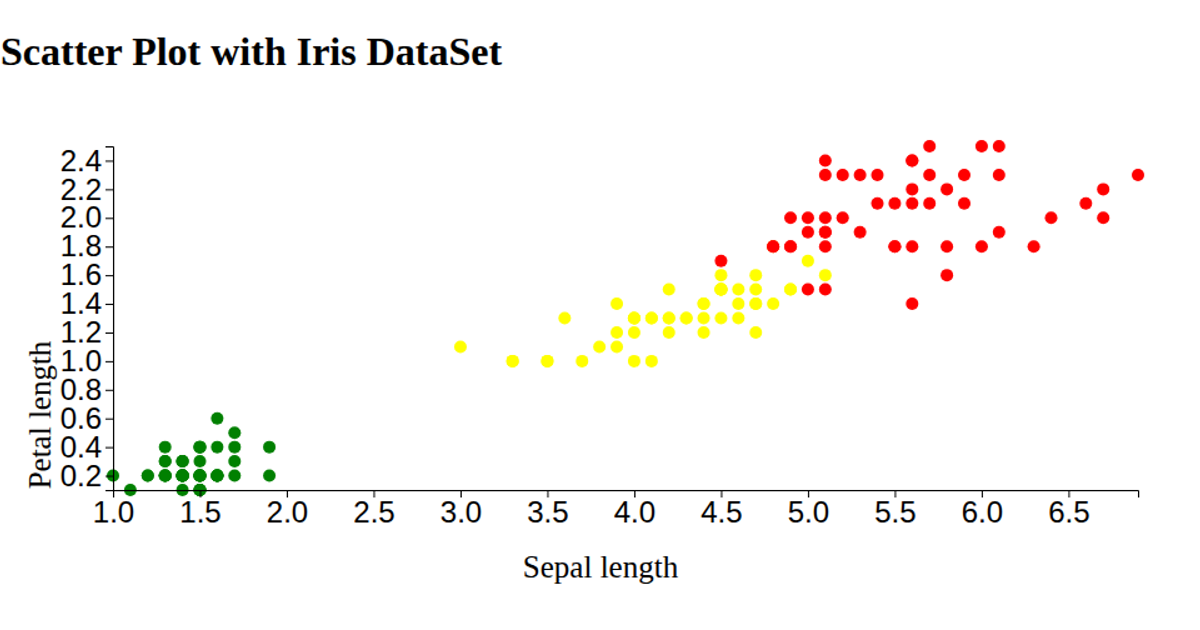
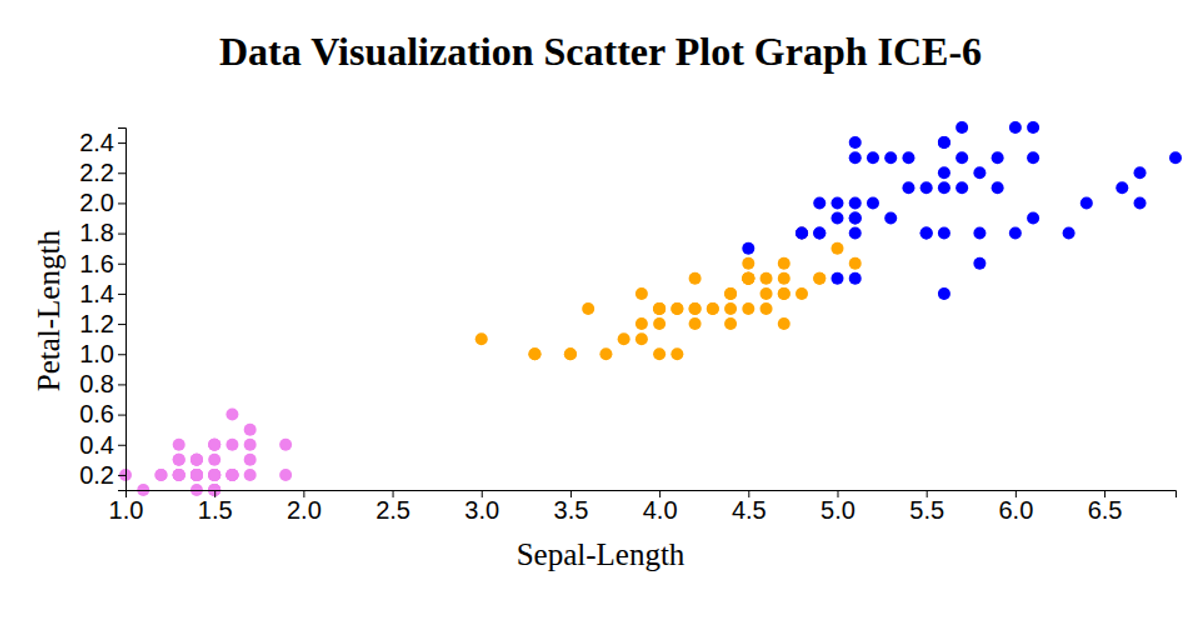
This scatter plot visualizes the Iris dataset, showing the relationship between petal width and sepal length. Points are colored by species (setosa, versicolor, virginica) with white strokes against a blue background. The visualization uses D3.js APIs including `scaleLinear`, `axisLeft`, `axisBottom`, and `extent` to map data coordinates. Data loads from a CSV URL and renders as SVG circles with a configurable radius. A custom module pattern enables dynamic updates to the x-axis value, which cycles through different columns.
AI-generated descriptionMIT Licensed




Comments
Sign in to join the discussion.