🌍 Public
Fork of map with legend
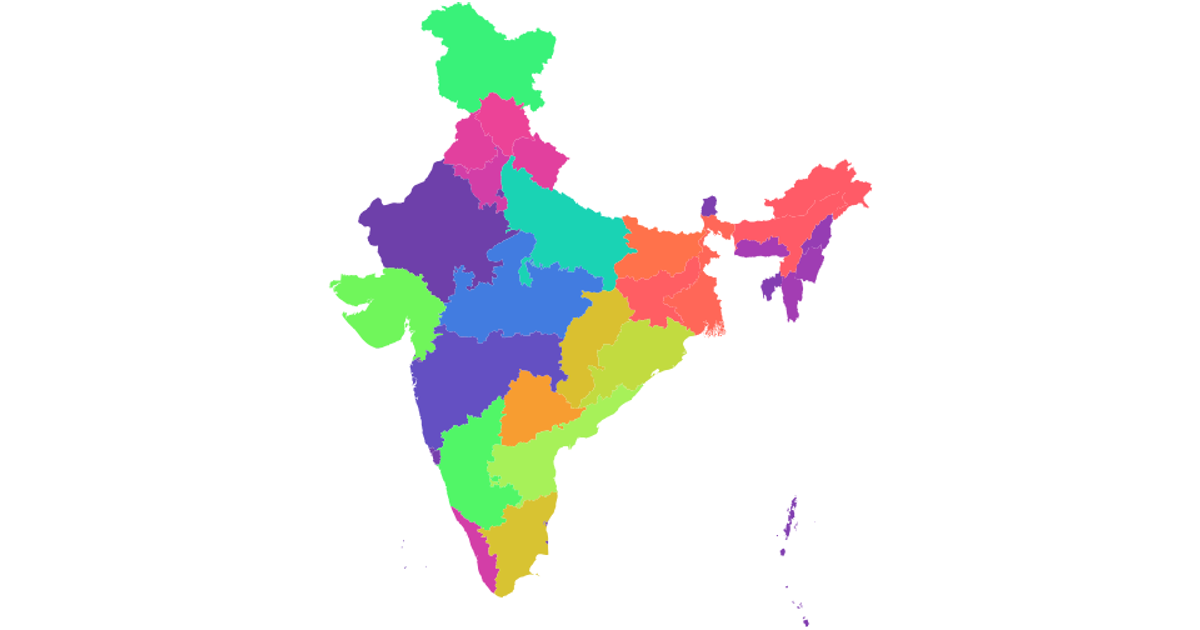
This choropleth map displays Indian states, with each polygon’s fill color mapped to its AREA_ attribute. The color scale uses a sequential interpolator with a rainbow gradient, applied via `d3.scaleSequential` and `d3.interpolateRainbow`. The map is rendered as SVG using React and `react-dom`, with topology loaded from a remote TopoJSON URL. Geographic projection and paths are generated with `geoMercator` and `geoPath`, while the data array is processed through `topojson.feature`.
AI-generated descriptionMaking map in react d3 method 1
MIT Licensed



Comments
Sign in to join the discussion.