🌍 Public
Fork of Vega-Lite API Template-- faizal
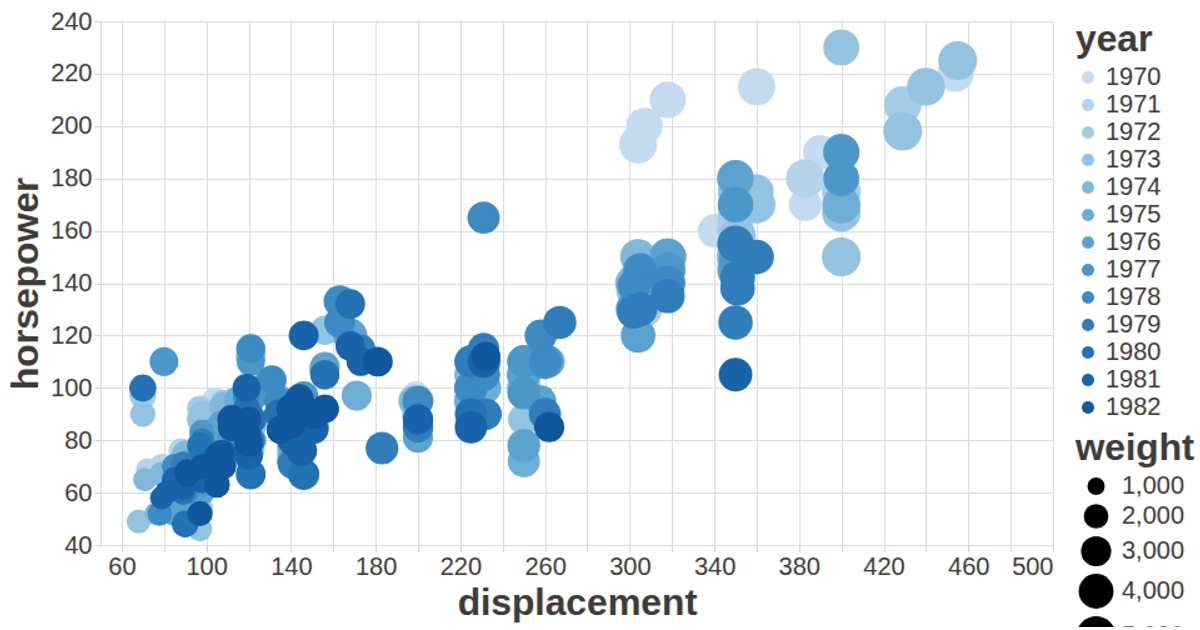
This visualization uses the Vega-Lite API to render a scatterplot of automobile data from an auto-mpg CSV dataset, with displacement on the x-axis and horsepower on the y-axis. Each point is semi-transparent blue, and hovering reveals the vehicle name via tooltips. The code registers Vega-Lite with D3’s CSV loader, applies custom axis and label styling from a config object, and dynamically sizes the chart to the window. It demonstrates the vega-lite-api library’s programmatic specification-building approach.
AI-generated descriptionA visualization constructed using the vega-lite-api.
MIT Licensed




Comments
Sign in to join the discussion.