🌍 Public
Fork of Scatter Plot with Shape
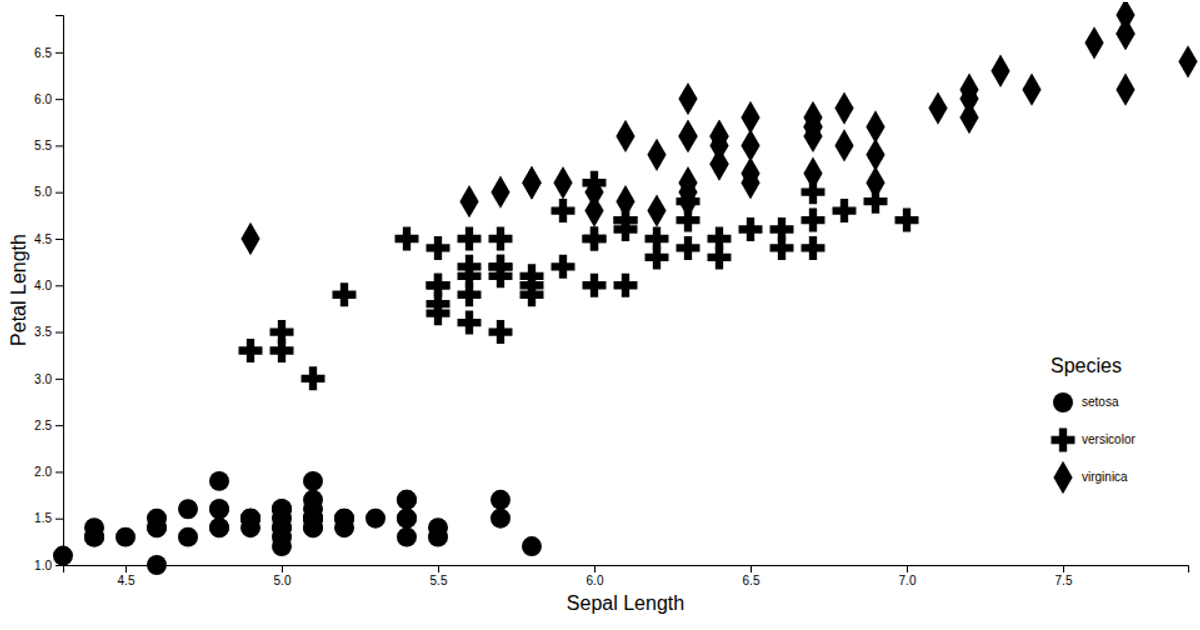
This example visualizes the iris dataset as a scatter plot, mapping sepal length to the x-axis and petal length to the y-axis, with species differentiated by symbol shapes from d3.symbol and d3.scaleOrdinal. A custom shape legend displays each species’ symbol, while d3.axisBottom and d3.axisLeft render labeled axes. The code loads data via d3.csvParse from a GitHub-hosted CSV and uses d3’s join pattern to update SVG elements.
AI-generated descriptionMIT Licensed




Comments
Sign in to join the discussion.