🌍 Public
diabaties and details
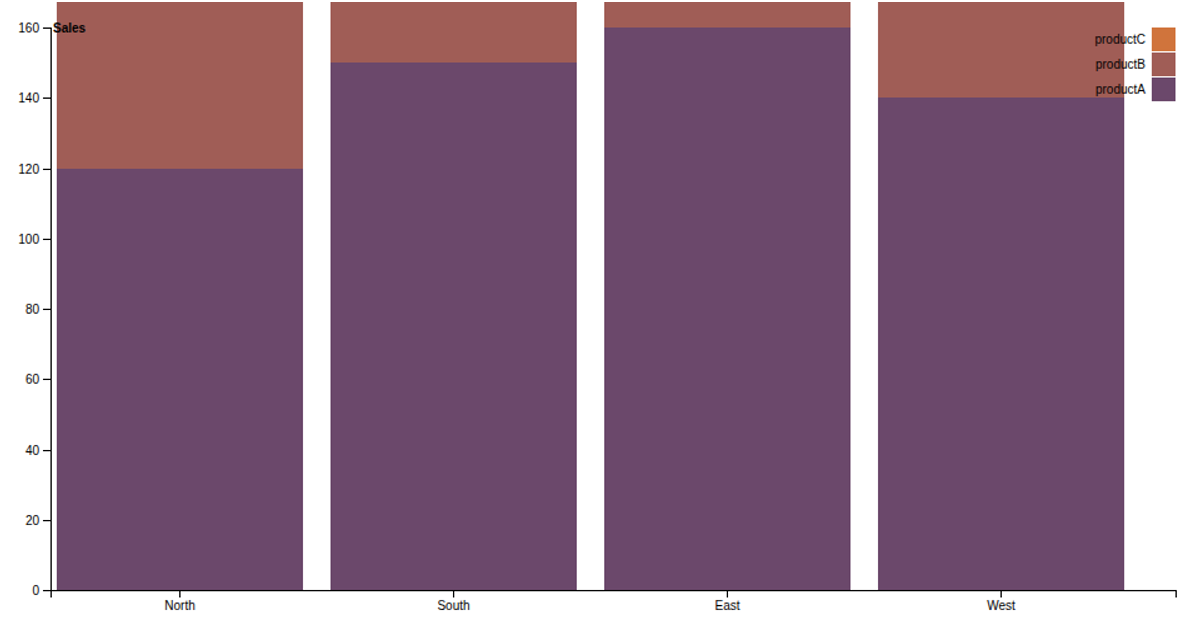
A bar chart displays regional diabetes-related sales data from a CSV file, with each region on the x-axis and sales values on the y-axis. The visualization shows the sales figures for ten regions, ordered as they appear in the data. The chart uses the D3.js library (v7) to create the SVG-based bar chart, employing d3.csv to load the data, d3.scaleBand for the categorical x-axis, and d3.scaleLinear for the numerical y-axis, with axis labels and a title included.
AI-generated descriptionMIT Licensed


Comments
Sign in to join the discussion.