🌍 Public
Fork of Fork of Fork of Fork of ICE - 7 Pie Chart Maanas Katta
Cchandanagandla
Last edited Apr 8, 2023
Created on Apr 8, 2023
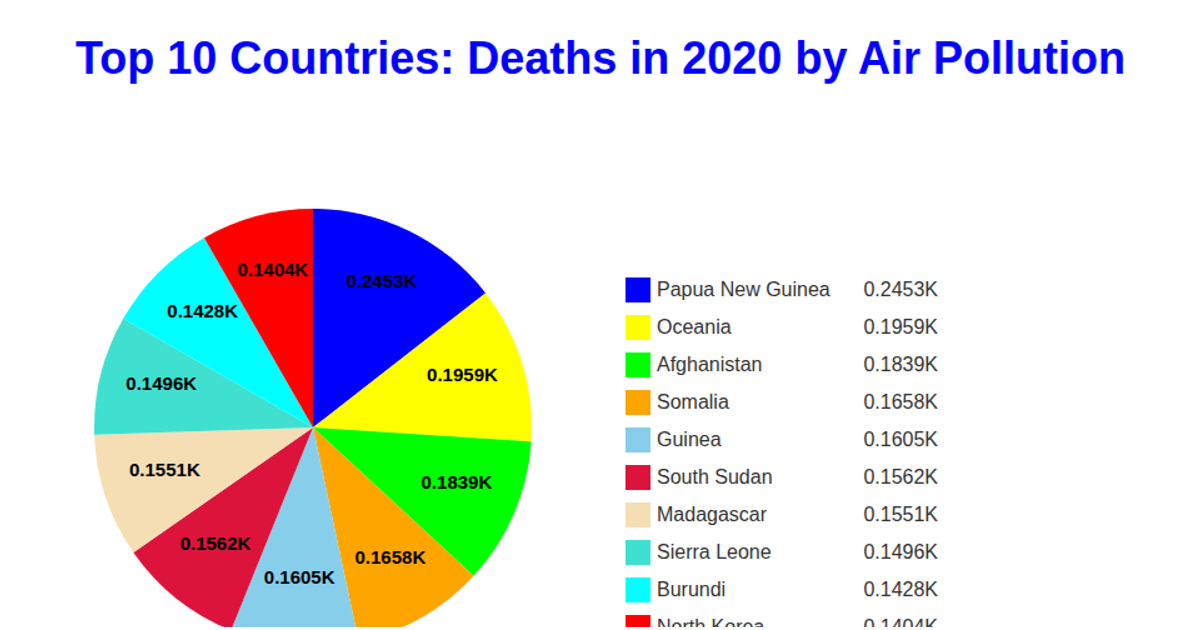
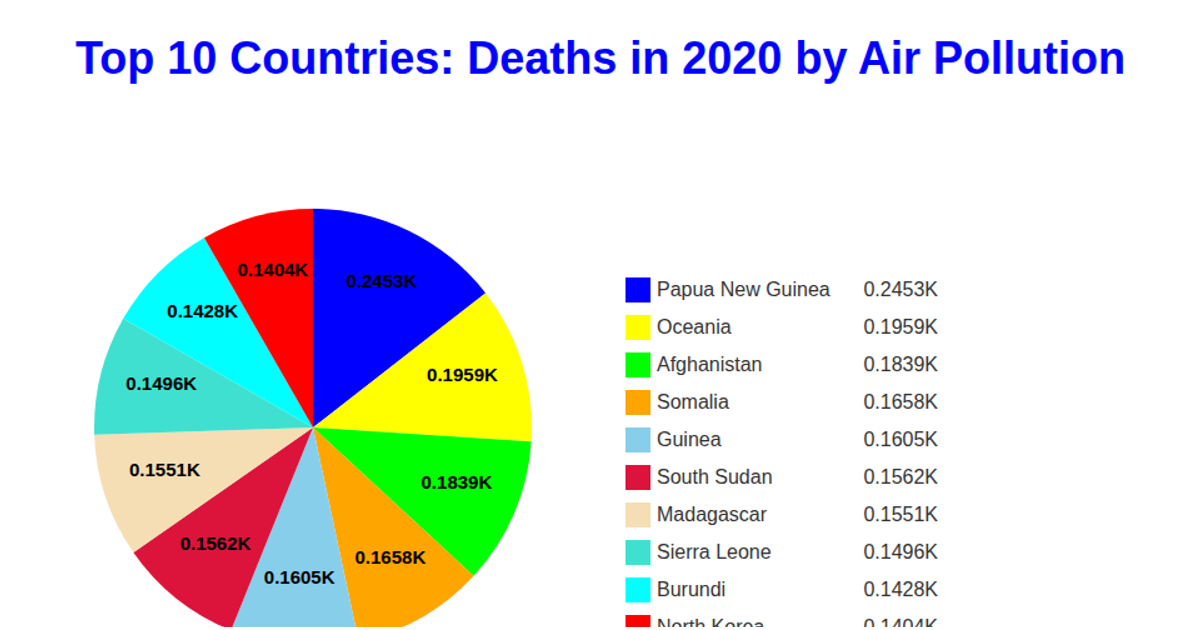
This D3.js pie chart visualizes the top 10 countries by 2020 air pollution deaths, sourced from a GitHub-hosted CSV. The code uses the `d3.pie` layout and `d3.arc` generator to draw the chart's sectors, with colors assigned via `d3.scaleOrdinal`. A legend displays each country and its corresponding death count, formatted with `d3.format`. The chart is rendered as SVG, and the data is loaded asynchronously using the `d3.csv` method.
AI-generated descriptionMIT Licensed





Comments
Sign in to join the discussion.