🌍 Public
sekhar que1.1
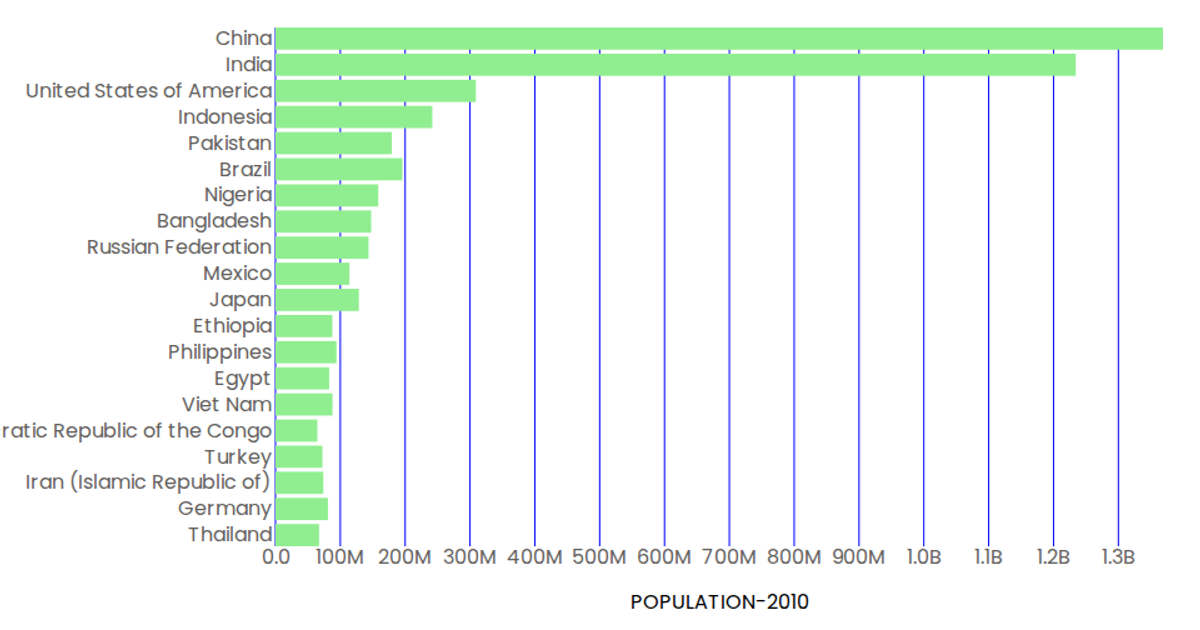
This example shows a horizontal bar chart of population figures for ten countries in the year 2000, with country names on the y-axis and formatted population values (in billions) on the x-axis. The chart uses React components to render SVG elements, with d3.scaleBand and d3.scaleLinear for positioning, and d3.csv loads the data from a GitHub-hosted CSV file. Bars are colored light green, axis ticks are styled blue, and tooltips appear on hover via SVG title elements.
AI-generated descriptionMIT Licensed





Comments
Sign in to join the discussion.