🌍 Public
Fault Localization 9 load csv
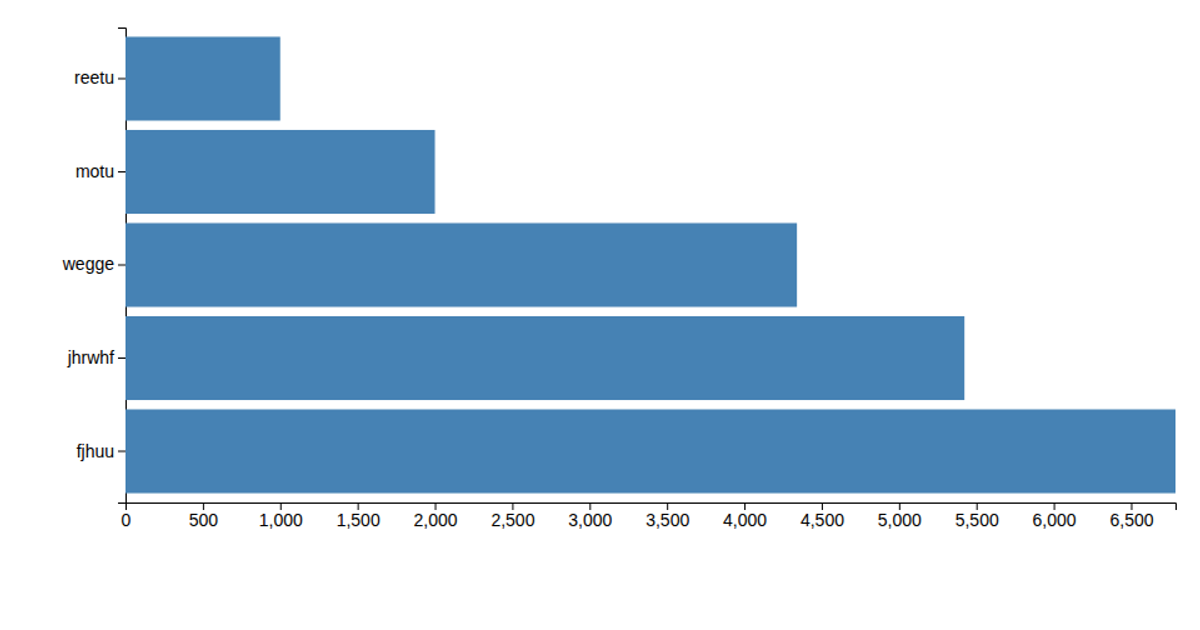
Fault Localization 9 load csv presents three horizontally arranged bar charts comparing suspiciousness, recency, and line complexity across 25 source-code lines from Apache Commons Lang. Each chart uses D3 v5’s `scaleLinear` and `scaleBand` to map numeric values and line identifiers to SVG rectangles. Clicking colored sort buttons (red, orange, steelblue) reorders all three charts by that metric. Data is loaded from an external CSV via `d3.csv`.
AI-generated descriptionMIT Licensed



Comments
Sign in to join the discussion.