🌍 Public
D3 bar charts
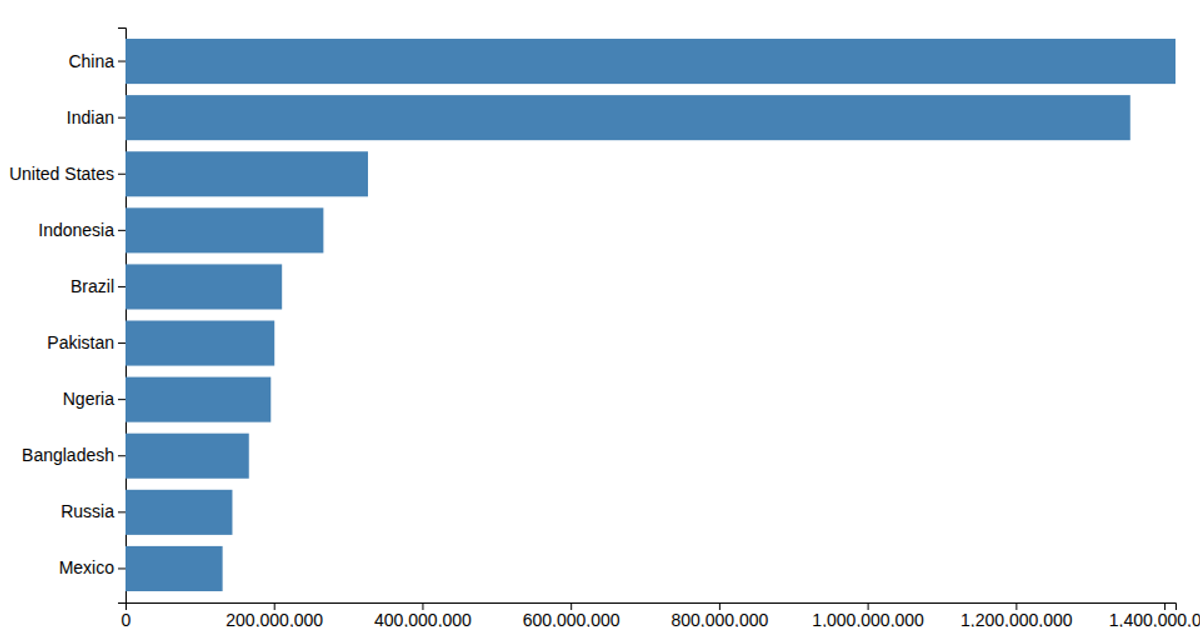
This example displays a static SVG bar chart of population counts for ten countries, sourced from a CSV file. The chart uses D3 v7 to select the SVG element and read its width and height attributes, preparing the coordinate space. While the code imports `select` and `csv` from D3, the data-loading call is commented out, so the bars themselves are not rendered to the screen. The visualization demonstrates the setup phase for building a bar chart with D3's SVG-based rendering.
AI-generated descriptionMIT Licensed






Comments
Sign in to join the discussion.