🌍 Public
Fork of Reusable D3 Scatter Plot
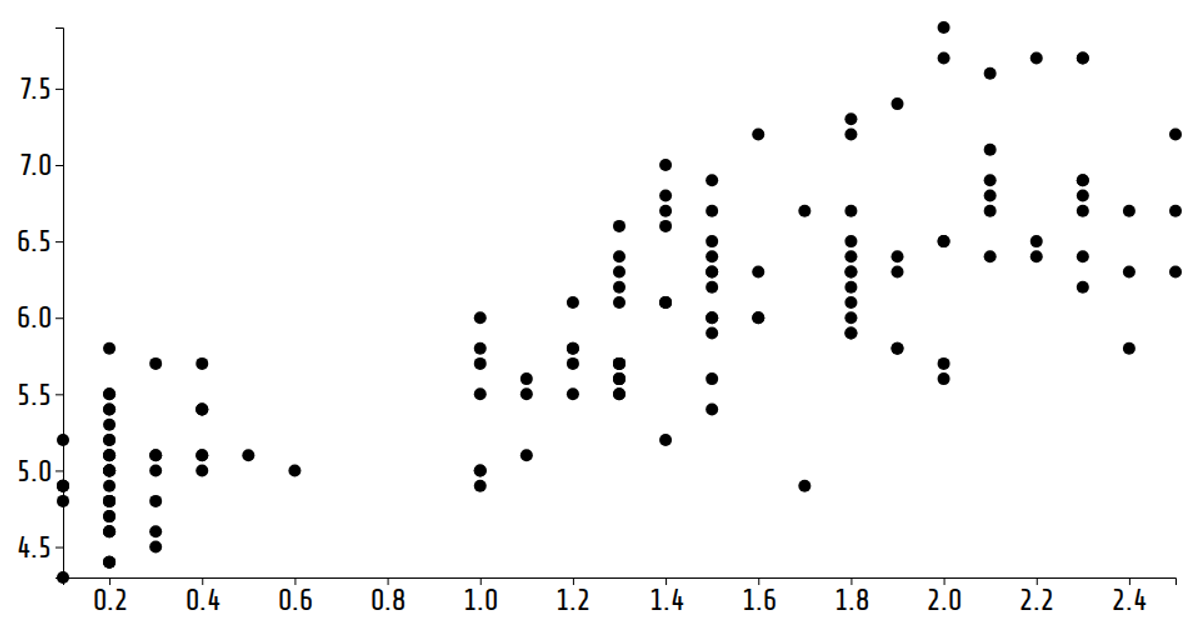
This fork of a reusable D3 scatter plot displays the Iris Dataset, but the visible rendering is a choropleth map of China. The code initializes a scatter plot module, then uses D3’s `geoMercator`, `geoPath`, and `scaleOrdinal` to project and color geographic regions from `map.json`. Mouseover highlights provinces in yellow. SVG rendering and the Share Tech font style the map, while the scatter plot functions remain defined but unused.
AI-generated descriptionA reusable scatter plot inspired by Towards Reusable Charts.
Shows the Iris Dataset.
MIT Licensed




Comments
Sign in to join the discussion.