🌍 Public
US fertility rate Line Chart
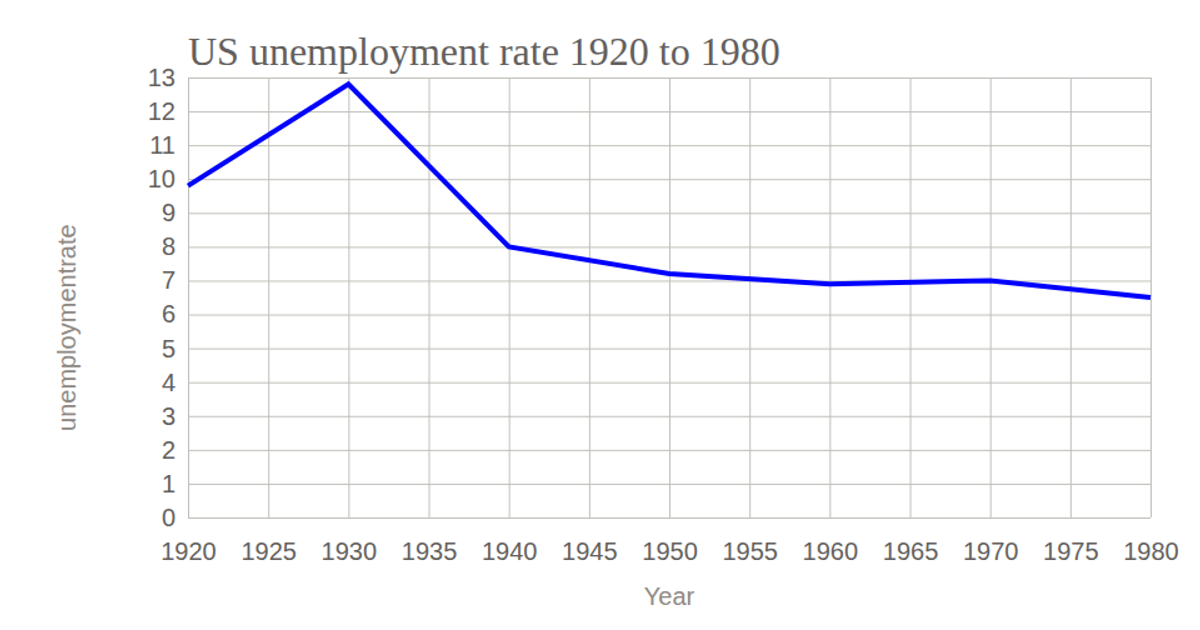
This line chart visualizes the US fertility rate from 1960 to 2016. The data, sourced from Kaggle’s World Bank dataset, is loaded via the `csv` function from D3 v5 and rendered as an SVG. The chart uses `scaleTime` and `scaleLinear` to map years and rates, with an axis on the left and bottom. A smooth line generated by `line` with `curveBasis` shows the declining trend, while styled tick lines and labels are applied via CSS.
AI-generated descriptionThis line chart shows the US fertility rate from 1960 to 2016. The data is scratched from Kaggle - World Bank Data (1960 to 2016).
MIT Licensed




Comments
Sign in to join the discussion.