🌍 Public
Organization Network Graph
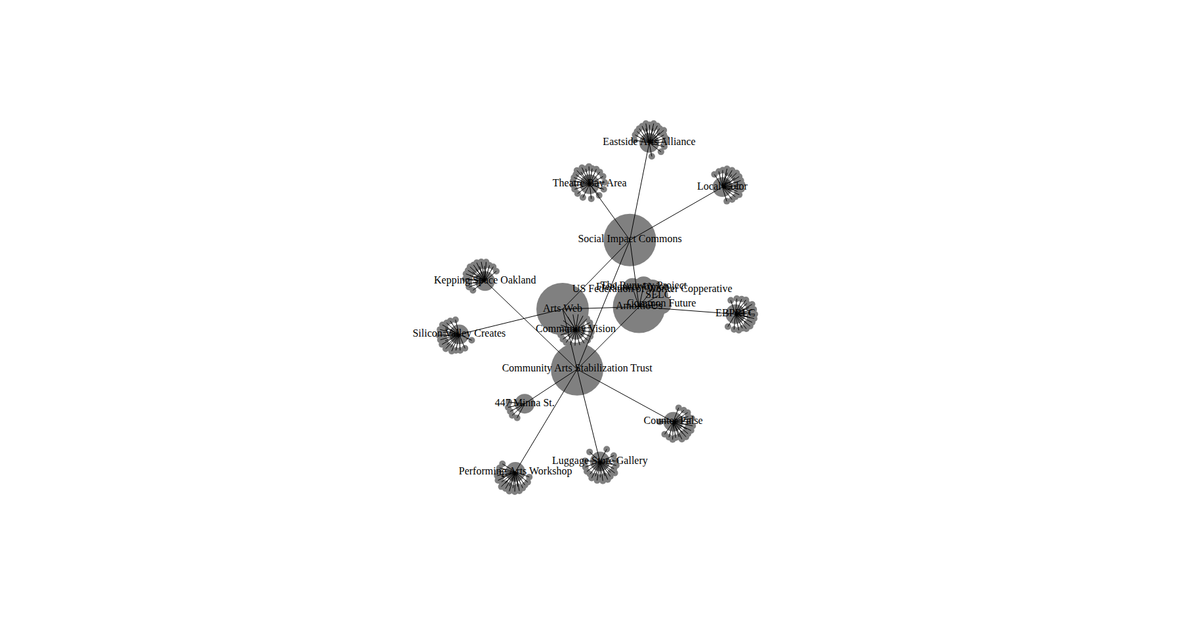
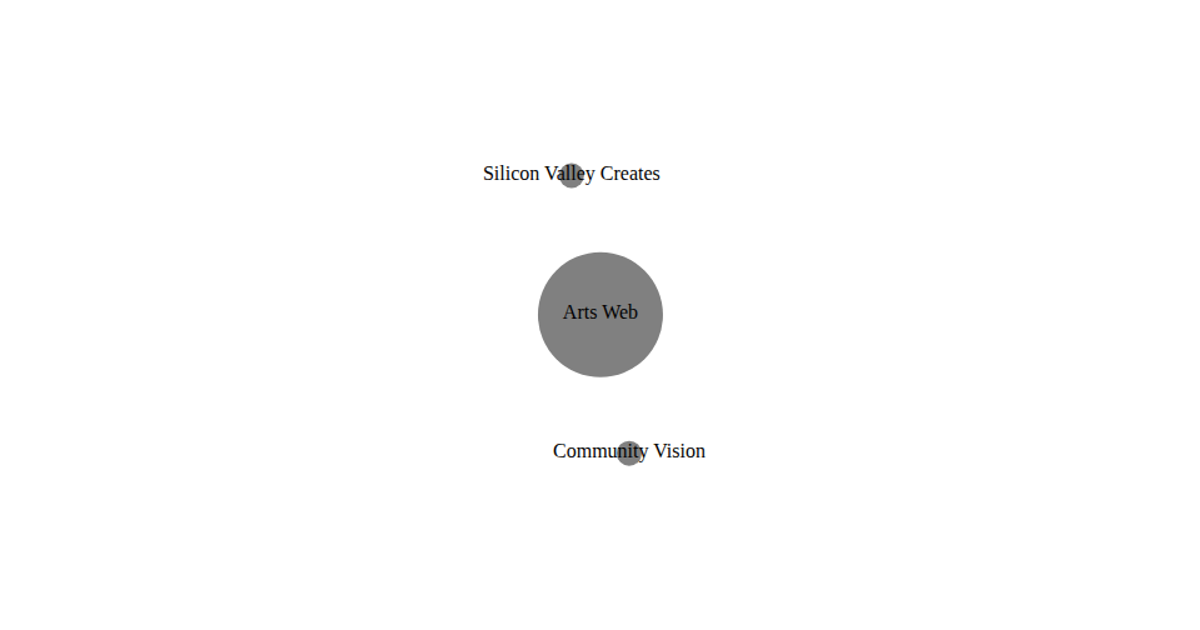
The visualization displays a network graph of interconnected community arts organizations in the San Francisco Bay Area. Using D3 v6’s `forceSimulation` API with `forceManyBody`, `forceLink`, and `forceCenter` forces, it renders SVG circles and links. Each main organization has colored child nodes with leaf nodes, and labeled text. Nodes are draggable through D3’s `drag` interaction. Data is generated programmatically with pre-defined color palettes from `colors.js`.
AI-generated descriptionOrganization Network Graph
MIT Licensed




Comments
Sign in to join the discussion.