🌍 Public
ice 6 Dataset
Mmanishcheruku
Last edited Mar 10, 2023
Created on Mar 10, 2023
Forked from ICE6 - Q2: Scatter Plot for Penguin Dataset
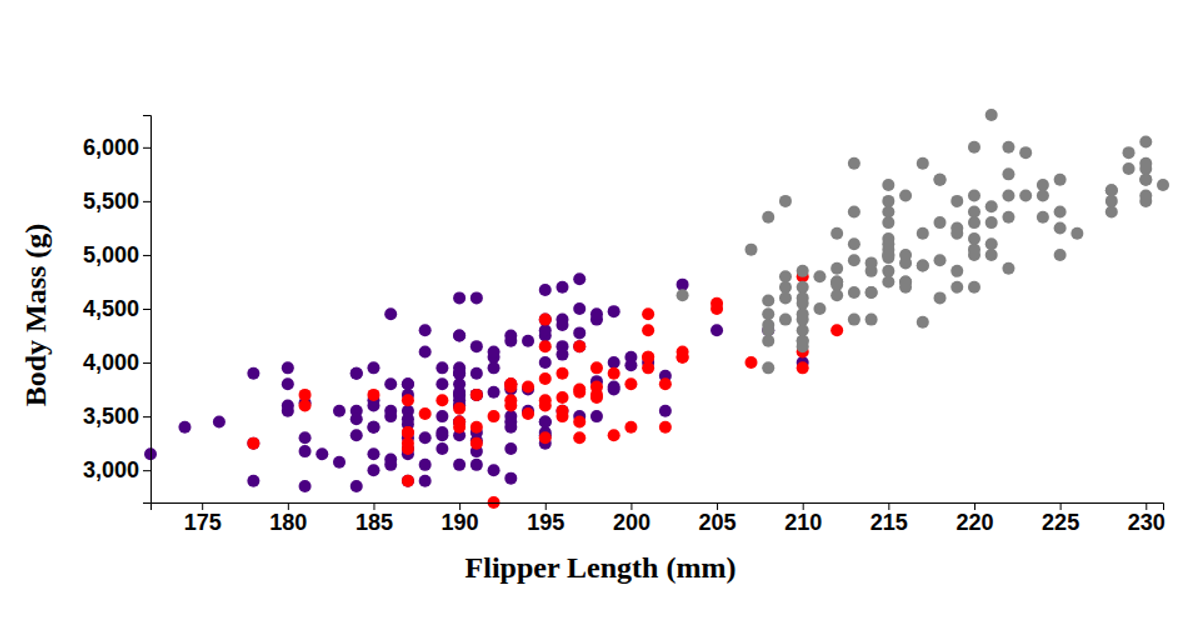
This scatter plot visualizes the Palmer Penguins dataset, showing the relationship between flipper length (x-axis) and body mass (y-axis) for three penguin species, distinguished by color. Built with D3 v6 and React, it uses `d3.csv`, `scaleLinear`, `extent`, and `axisBottom`/`axisLeft` to render SVG circles. The code maps categorical species values to distinct colors, with data loaded from a GitHub gist and axes labeled in millimeters and grams.
AI-generated descriptionA bare minimum HTML page demonstrating use of CSS and JavaScript.
See also React Starter.
MIT Licensed



Comments
Sign in to join the discussion.