🌍 Public
RS Color and Size Legends
Ddanrhymes
Last edited Mar 28, 2020
Created on Mar 27, 2020
Forked from RS Bowl of Fruit - General Update Pattern
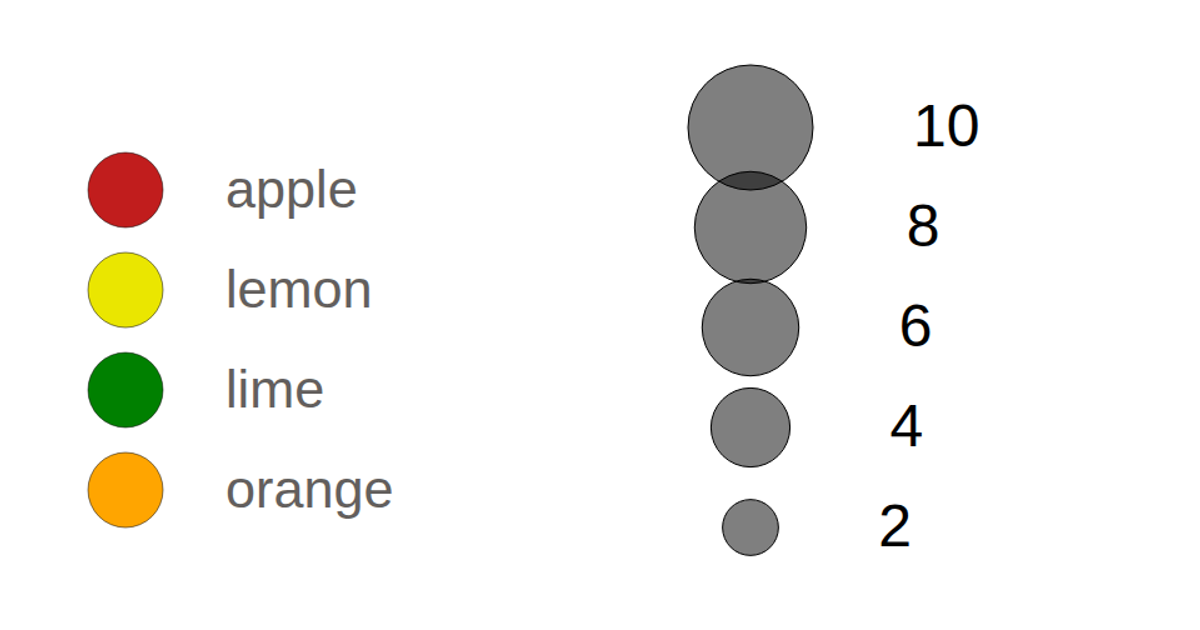
This example shows two reusable legend components for mapping data values to visual encodings. A color legend displays four ordinal fruit categories using distinct fills from d3.scaleOrdinal, while a size legend uses d3.scaleSqrt to encode numeric values as scaled circle radii. Both legends are built with D3 v5 selection joins, rendering SVG circles and text labels via custom enter/merge/exit patterns. The SVG output includes tick groups with styled text and semi-transparent circle strokes.
AI-generated descriptionMIT Licensed




Comments
Sign in to join the discussion.