🌍 Public
Fork of Reusable D3 Scatter Plot
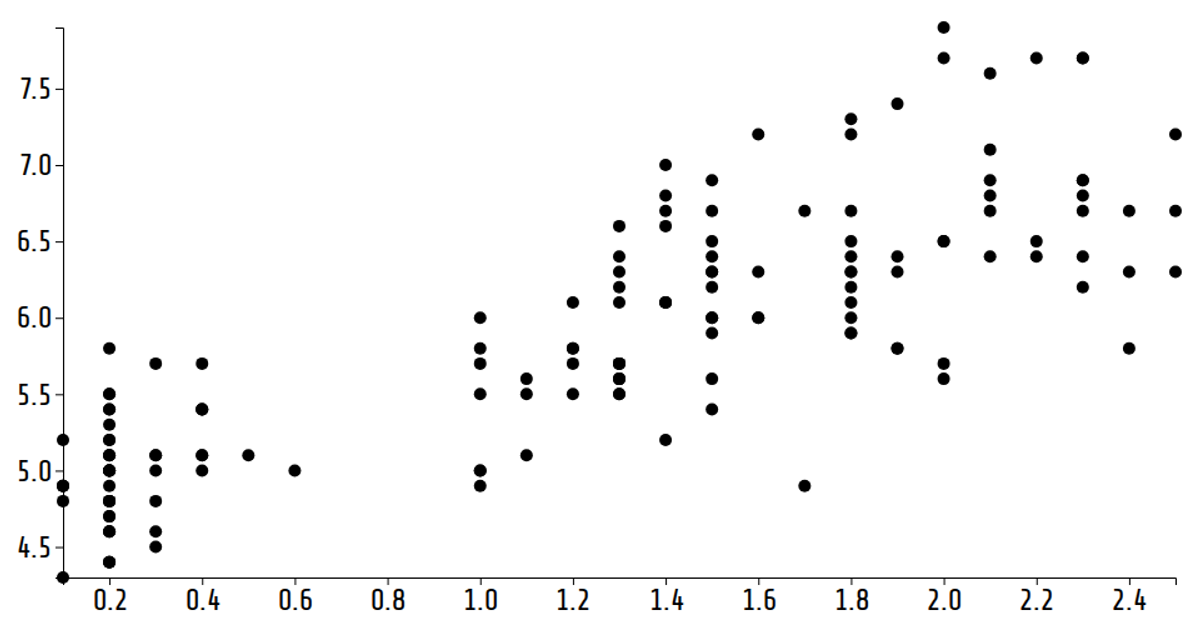
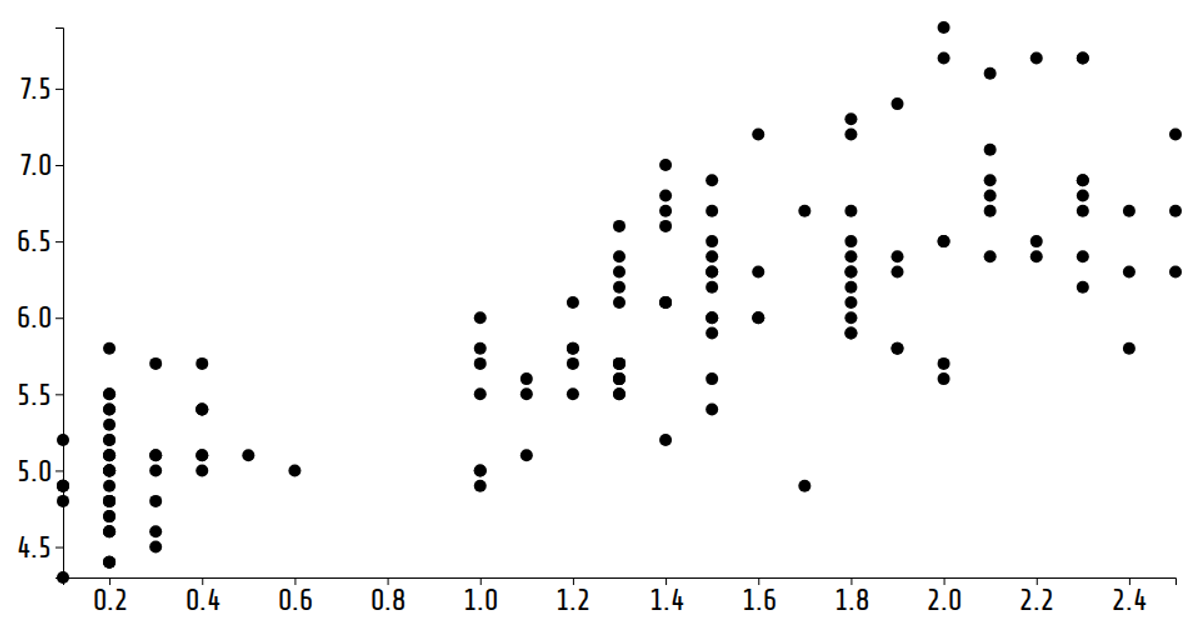
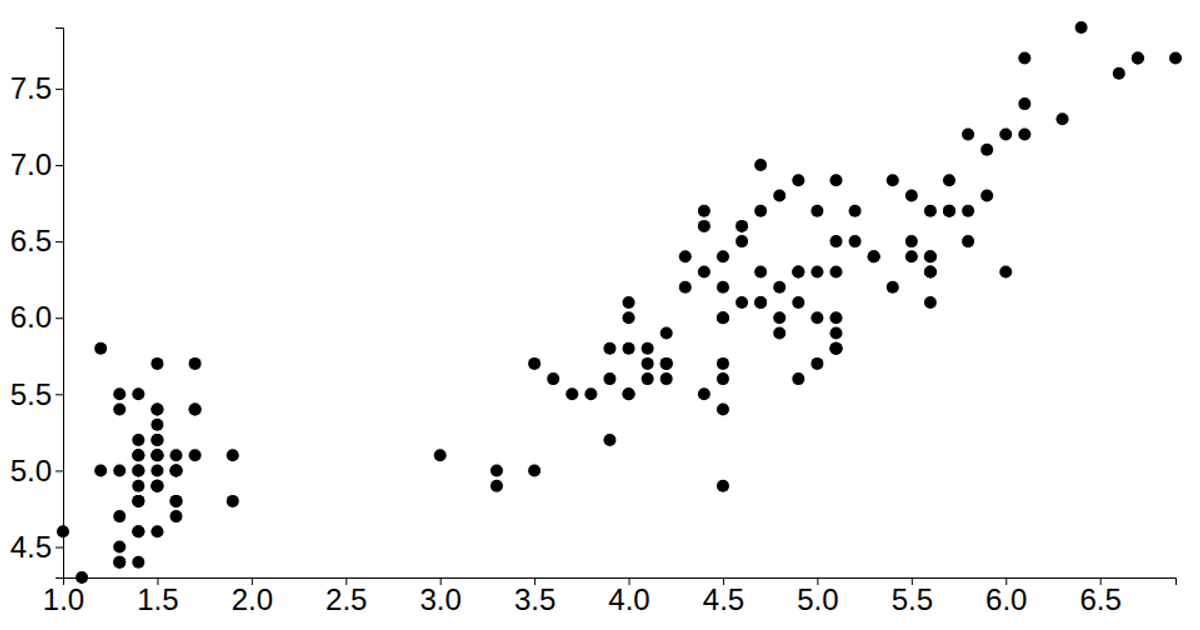
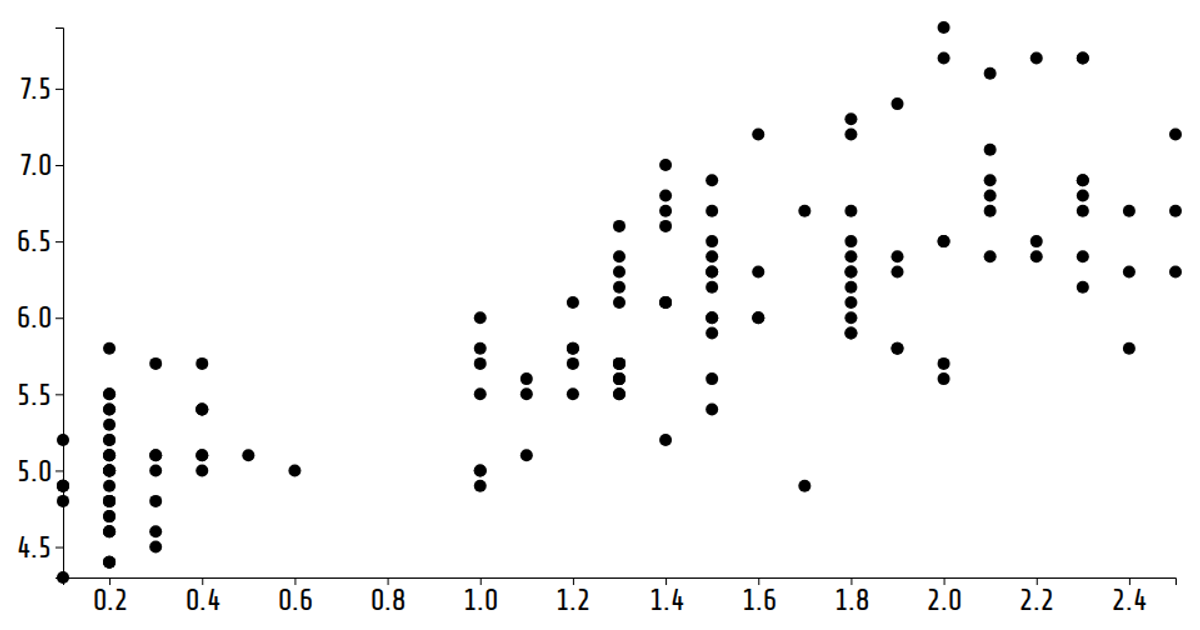
This fork of a reusable D3 scatter plot visualizes the Iris dataset, showing sepal length against sepal width. Each point represents an iris flower, colored by species (setosa, versicolor, virginica) with distinct circle, square, and triangle shapes. The chart is built using d3.scaleLinear, d3.axisBottom, and d3.axisLeft, with the reusable scatterPlot function exposing configurable width, height, margin, and radius. Data is loaded via d3.csv with d3.autoType, and circles are rendered with adjustable opacity and stroke styling.
AI-generated descriptionA reusable scatter plot inspired by Towards Reusable Charts.
Shows the Iris Dataset.
MIT Licensed




Comments
Sign in to join the discussion.