🌍 Public
nmbjo;
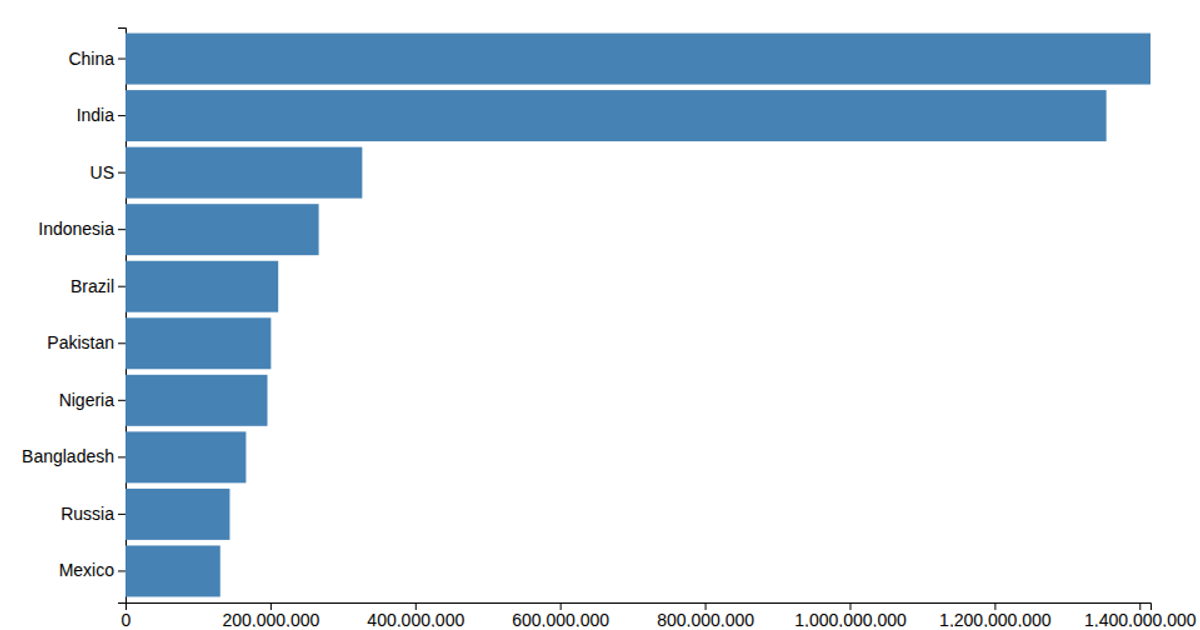
This bar chart displays population figures for ten countries, with country names on the y-axis and population values on the x-axis. The chart uses D3 v7's `scaleBand` and `scaleLinear` to map data, with `axisLeft` and `axisBottom` generating the axes. Data is loaded from a CSV file and rendered as SVG rectangles filled in steelblue, with margins applied to the chart area.
AI-generated descriptionMIT Licensed




Comments
Sign in to join the discussion.