🌍 Public
Activity8_Task4
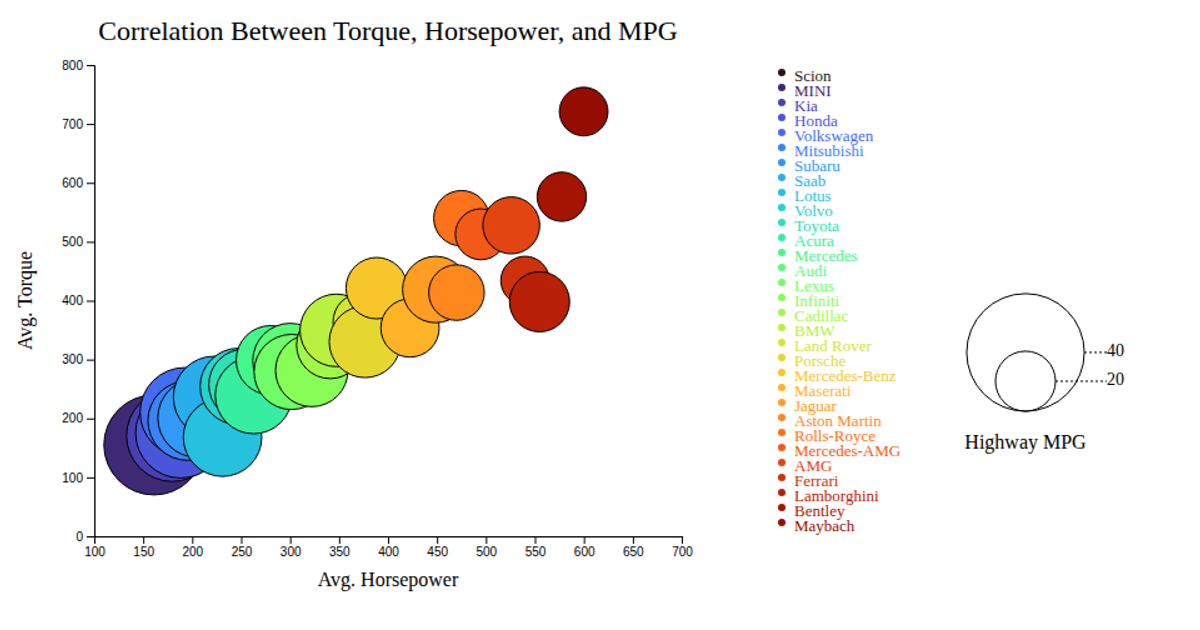
This bubble chart visualizes the correlation between average horsepower, torque, and highway MPG across 31 car makes, with each circle's position determined by the x- and y-scales and its size encoding MPG via the `d3.scaleLinear` z-scale. Color mapping via `d3.scaleOrdinal` and `d3.interpolateTurbo` distinguishes makes, while animated hover effects and a custom tooltip built with D3 event handlers reveal the make name. The SVG chart includes labeled axes, a legend with circles for MPG values and color swatches, and reads from a CSV file using `d3.csv`.
AI-generated descriptionMIT Licensed






Comments
Sign in to join the discussion.