🌍 Public
Making a line chart with multiple lines
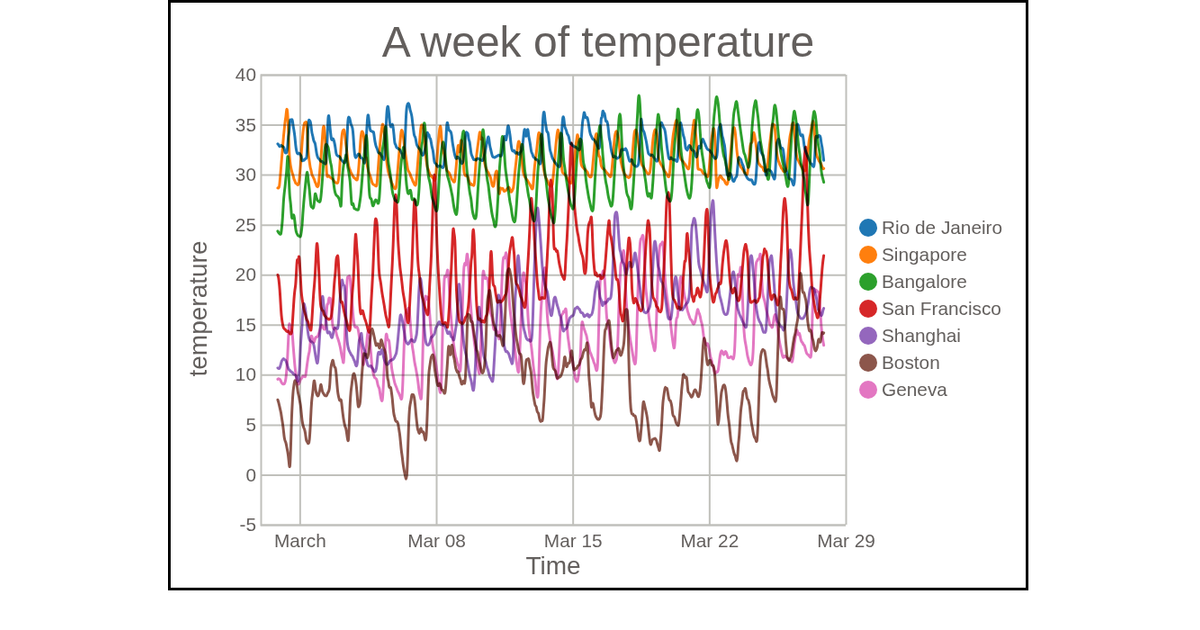
This visualization depicts a week of temperature data for San Francisco, shown as a multi-line chart where temperature trends are traced over time. Using D3 v7, the code employs `scaleTime` and `scaleLinear` to map the temporal and temperature axes, while `nest` and `curveBasis` generate smooth lines for each city. A color legend, built with `colorLegend`, uses `scaleOrdinal` and `schemeCategory10`. Data comes from a CSV file, rendered as SVG with styled paths using `mix-blend-mode:multiply`.
AI-generated descriptionMIT Licensed







Comments
Sign in to join the discussion.