🌍 Public
Fork of Scatter Plot with Color Legend
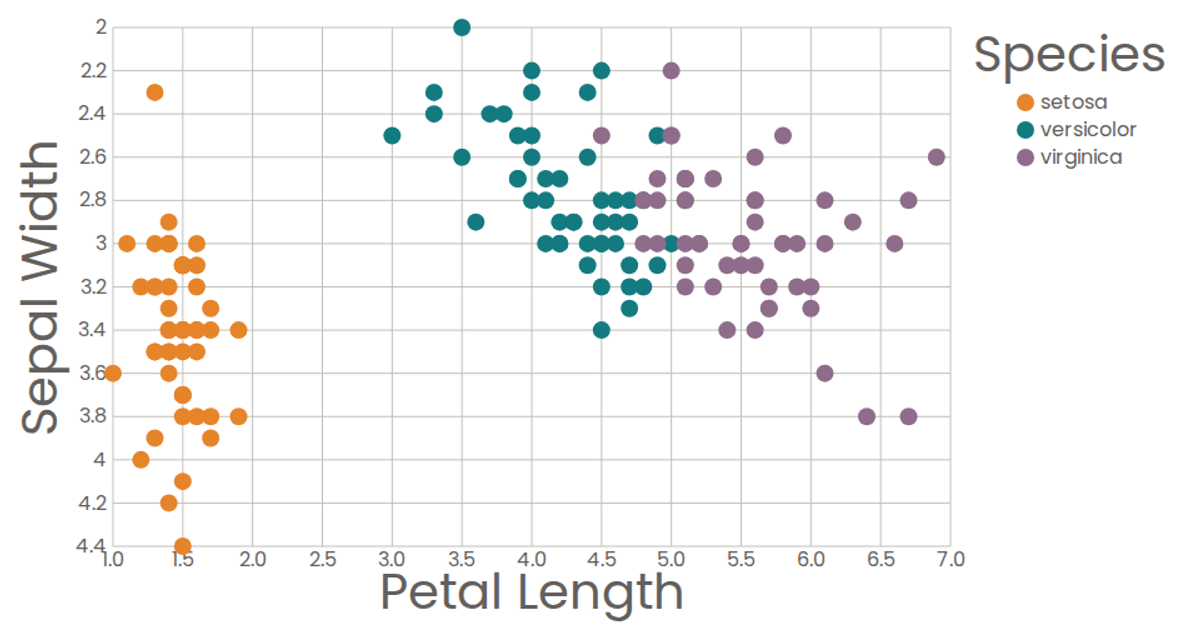
This scatter plot visualizes the Iris dataset, mapping petal length and sepal width for 150 flowers. A color legend encodes species, and hovering over a legend item highlights that species by reducing the opacity of all other points. The code uses React with SVG rendering, d3.scaleLinear for axes, d3.scaleOrdinal for colors, and custom React components for marks and legends.
AI-generated descriptionA scatter plot of The Iris Dataset with color legend.
MIT Licensed


Comments
Sign in to join the discussion.