🌍 Public
Scatter Plot
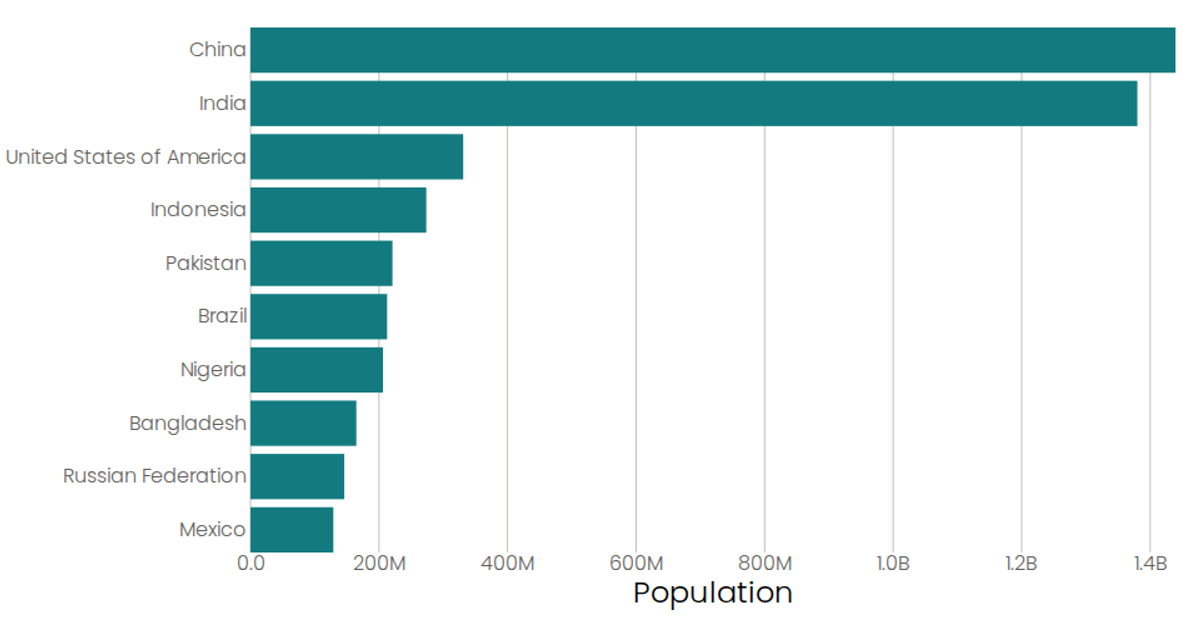
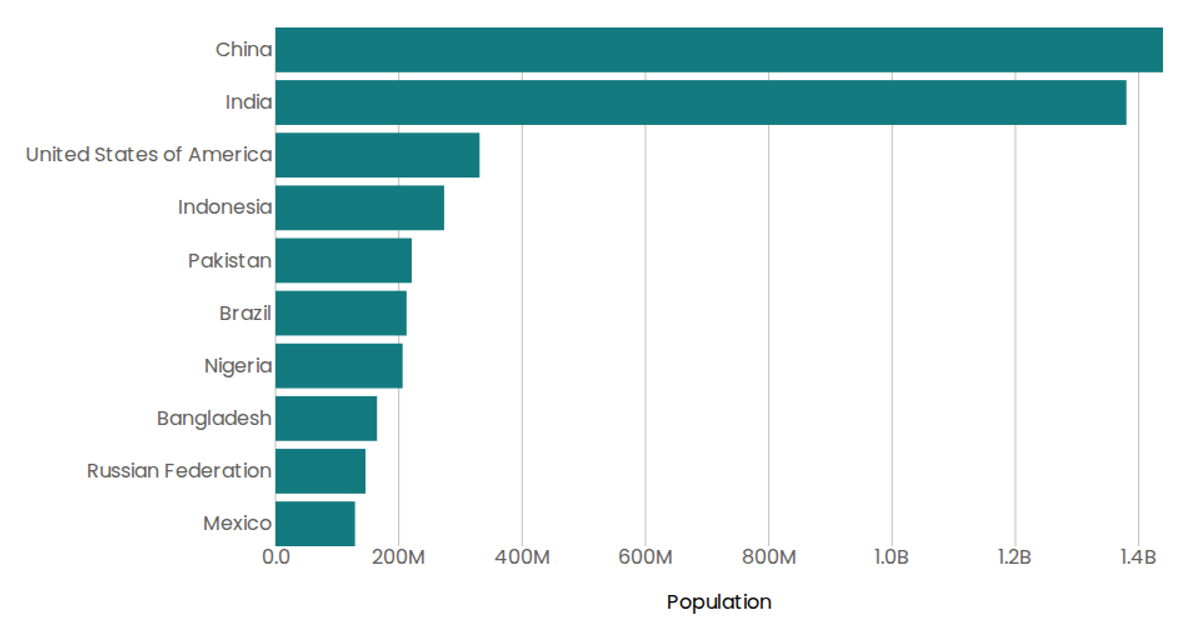
This example displays a horizontal bar chart of population figures for ten countries from the 2019 UN Population dataset, loaded as CSV via D3’s `csv` utility. The visualization uses `scaleBand` for the categorical country axis and `scaleLinear` for the population axis, rendering SVG bars through React components. A native SVG `<title>` tooltip shows formatted population values upon hover, while the axis labels and ticks are styled with D3 `format` to abbreviate large numbers.
AI-generated descriptionA program that loads in some data about CSS named colors using D3 utilities, and uses React state to keep track of the data.
MIT Licensed




Comments
Sign in to join the discussion.