🌍 Public
ice7-linechart
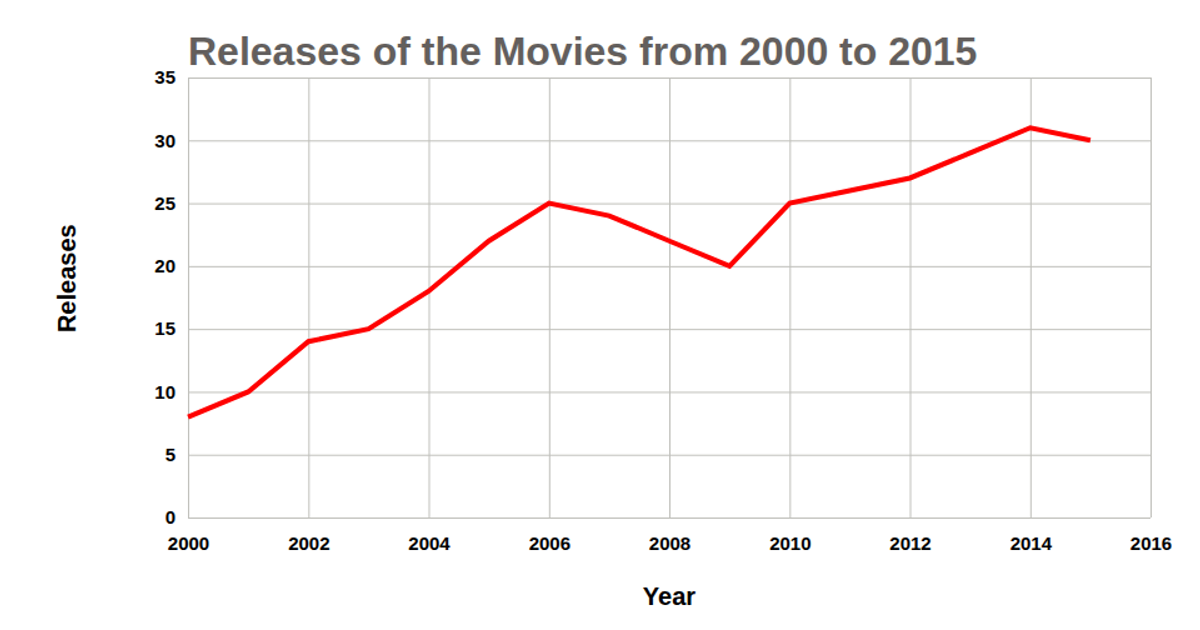
This line chart displays the rising popularity of Python from 2015 to 2024, using annual percentage values from a local CSV file. The chart renders as an SVG via React and D3, with data points marked by circles and labeled with their exact percentages, connected by a blue line. The implementation leverages a custom reusable chart factory, D3’s scaleLinear, axisLeft, axisBottom, and line generators, with axes and labels clearly annotated.
AI-generated descriptionMIT Licensed





Comments
Sign in to join the discussion.