🌍 Public
Fork of CSV Dataset Template - Penguins
This example renders a hierarchical tree visualization of Indian agricultural data from a CSV dataset. The visualization shows root and child nodes representing crop areas, with the tree layout computed by `d3.tree()` and rendered as an SVG with links drawn via `d3.linkHorizontal()`. The code fetches data from a remote URL using `d3.csv`, parses quantitative area values with `parseFloat`, and applies node styling through D3 selections and CSS classes. The tree serves as a template for importing and adapting custom datasets into VizHub.
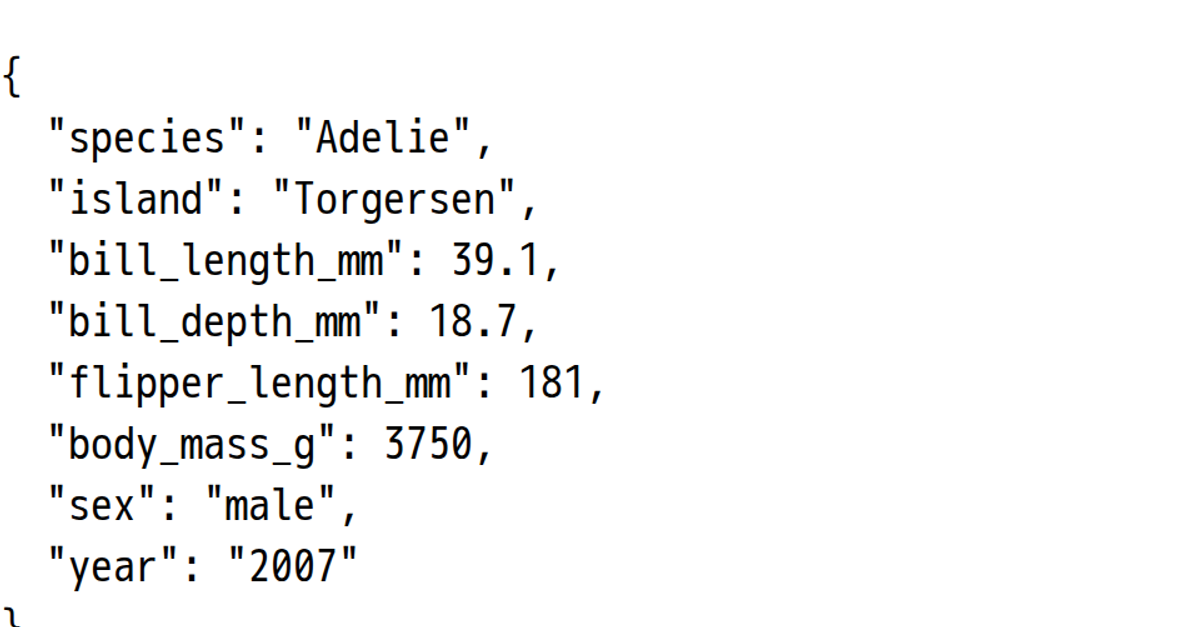
AI-generated descriptionThe Penguins Dataset, loaded and parsed as CSV.
Fork and modify this template to import your data to VizHub and export it for use in other vizzes! To do that:
- Fork this viz
- Clear out the README
- Update the README with details about your dataset (including original source)
- Replace
data.csvwith your own data - Replace the parsing logic in
index.jswith your own - Set the custom URL so you can import from it easily
Challenge
- Find 3 datasets on a topic you are interested in
- For each of those, fork this viz and replace the data
- Parse the quantitative attributes into numbers
- Update
README.mdto indicate the original data source
MIT Licensed


Comments
Sign in to join the discussion.