🌍 Public
ICE8 - Satya Vineeth Kusumanchi
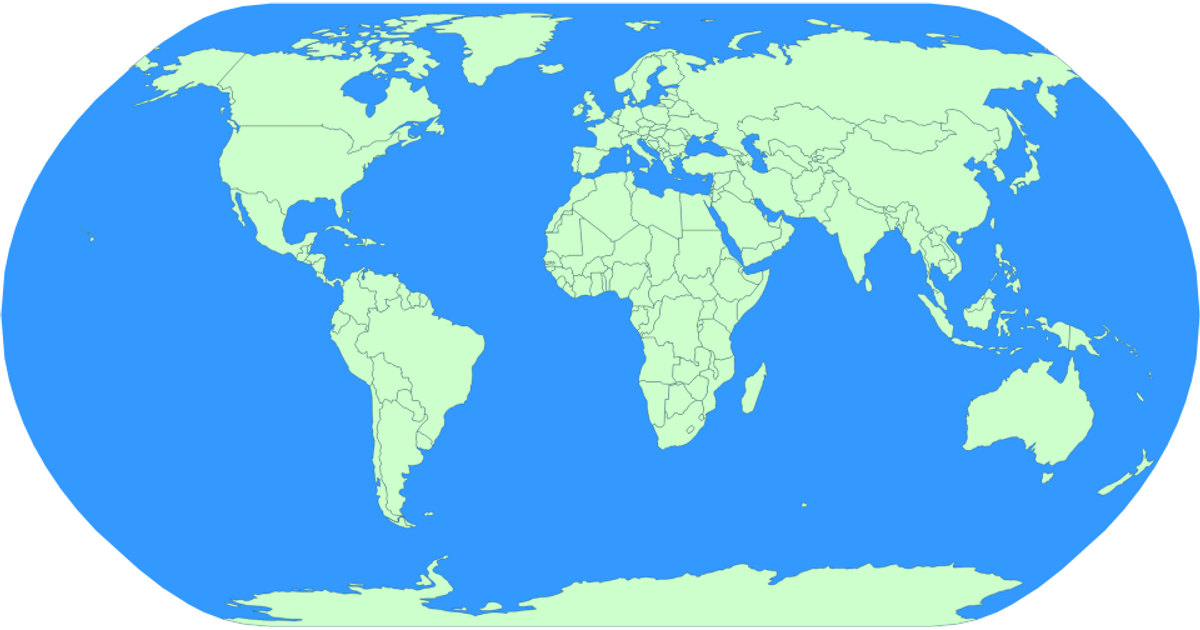
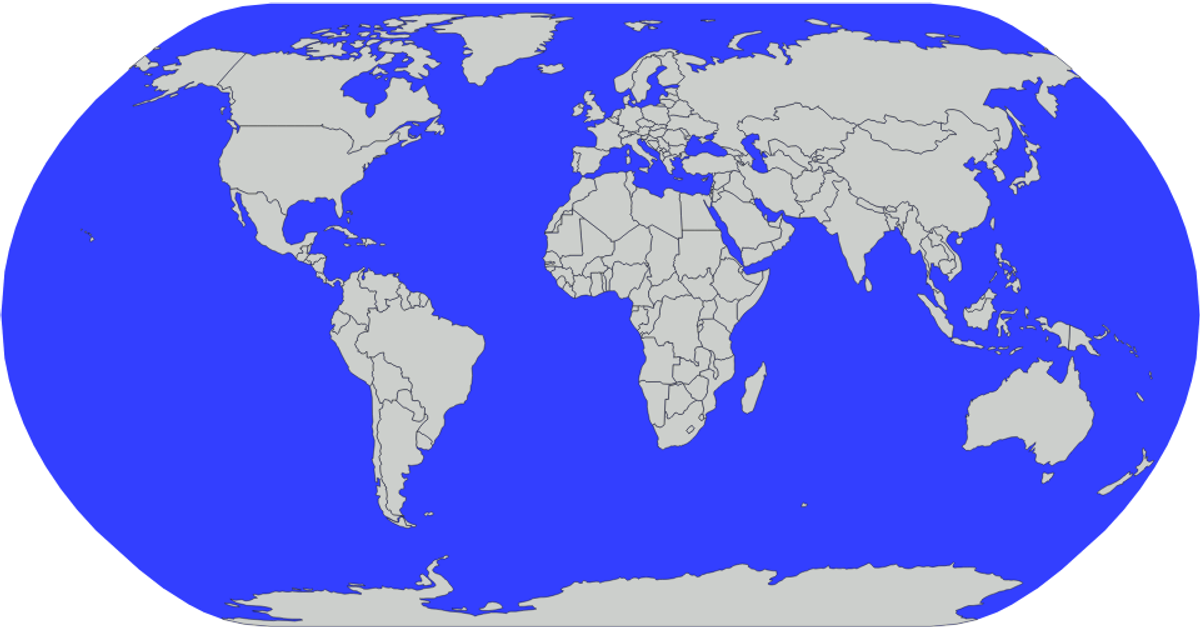
This visualization displays a world map using the Natural Earth projection, with blue fill for oceans and green fill for landmasses. Country borders are outlined in black strokes. The code loads geographic data from the world-atlas TopoJSON dataset and converts it to SVG paths using `d3.geoPath` and `topojson.feature`. Countries are rendered as individual paths, with the sphere background drawn separately to represent water.
AI-generated descriptionMIT Licensed


Comments
Sign in to join the discussion.