🌍 Public
Question1-vamsi
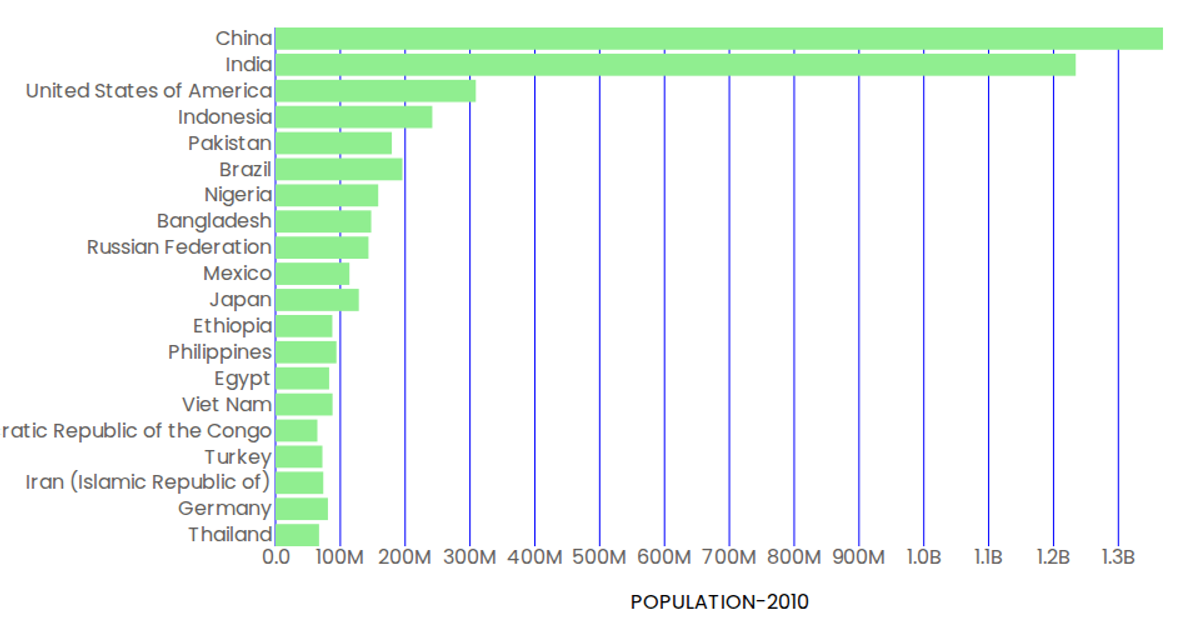
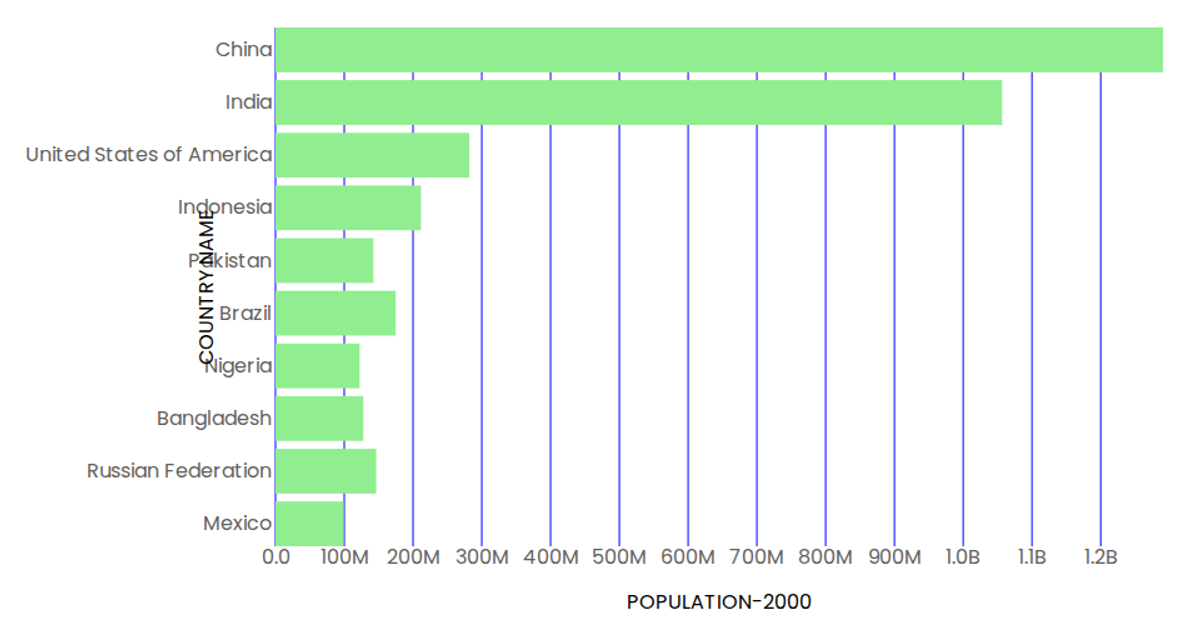
This bar chart displays the 2010 population estimates for 20 countries from a CSV dataset loaded via D3’s `csv` function. The chart uses React with SVG rendering, employing `scaleBand` for the categorical y-axis and `scaleLinear` for the numeric x-axis. Bars are drawn as SVG `<rect>` elements with tooltips using the native `<title>` element. Axis components render ticks and labels, with x-axis tick formatting via D3’s `format` helper to abbreviate large numbers (e.g., converting G to B).
AI-generated descriptionAn example showing the capabilities of VizHub:
- Loads D3 via UNPKG.
- Demonstrates use of
importfrom"d3". - Demonstrates use of
importfrom local ES6 modules.
MIT Licensed



Comments
Sign in to join the discussion.