Mallak Alkhathlan assignment 1
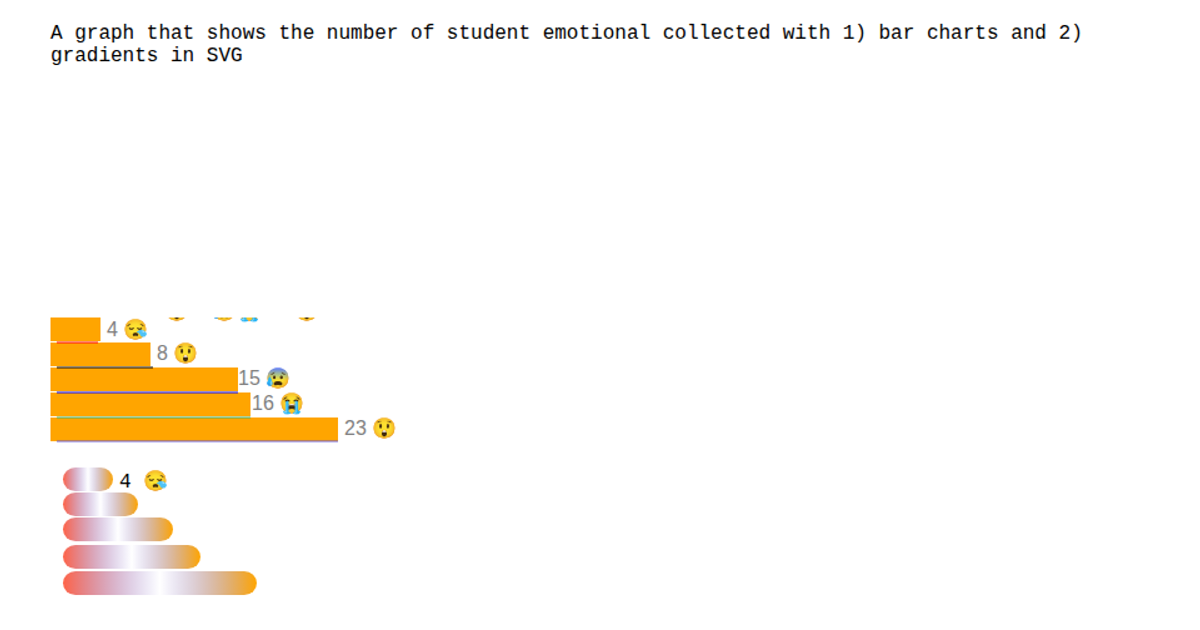
The graphic displays a survey of student emotional responses as a horizontal bar chart, with two distinct visual encodings. The first set of bars uses plain orange rectangles with emoji labels (e.g., 😤, 😂) to show counts, while the second set employs SVG linear gradients, transitioning through colors like Tomato, SlateBlue, and Orange, with rounded corners. The SVG uses CSS classes for hover interactions, changing bar fills to SlateBlue and text to Tomato. The chart, defined in an inline SVG within `index.html` and styled by `styles.css`, relies on native SVG elements (`rect`, `linearGradient`, `text`) and CSS transitions—no external JavaScript libraries.
AI-generated descriptionInspired by other people's work: 1)https://developer.mozilla.org/en-2)US/docs/Web/SVG/Tutorial/Gradients [Gradients] 3)https://www.w3schools.com/graphics/svg_stroking.asp [svg stroking] 4)https://www.w3schools.com/charsets/ref_emoji_smileys.asp [Emoji] 5)https://www.w3schools.com/css/css_colors.asp [CSS Color Names]


Comments
Sign in to join the discussion.